Docs
Scope
How to generate a recurring billing details report and the status of the payments?
What is recurring cashflow?
What is payment transaction breakdown?
Summary
The Recurring billing details/Recurring payments report can be exported from Recurring Cashflow (new name: Total Recurring Payments) and the status of the payments can be exported from the Payment Transaction Breakdown. You can access these reports from the RevenueStory > Dashboard tab.
Solution
I. Recurring Cashflow or Total Recurring Payments (new name for the metric)
The total value of successful payments received against recurring invoices.
Explanation of metric
A trend line chart depicts the total amount receivable from recurring invoices during a specific period.
A point-in-time indicator is also available for this metric. This KPI represents the total value of payments received in the current period. It also displays the variance of the value of payments received for the previous period and the percentage change across both periods. Refer to this link to know what Recurring Cashflow or Total Recurring Payments is in the RevenueStory.
II. Payment Transaction Breakdown
A breakdown of monthly payment transactions by payment status.
Explanation of metric
Revenue Story:
I. Via Dashboard:
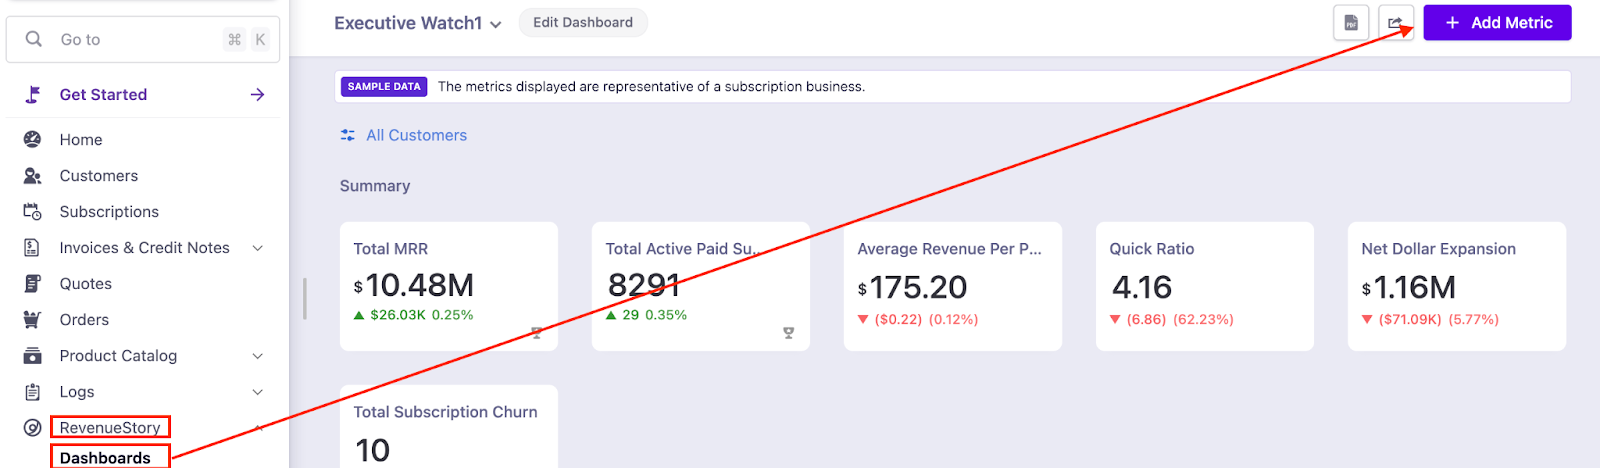
Dashboards provide a consolidated way to view all your reports and key performance indicators on a single page. RevenueStory has 10 default dashboards that will help you derive actionable insights. To add additional reports, click on 'Add Metric' from RevenueStory > Dashboard
Metric Explorer > Cashflow > Recurring Cashflow > Add to Dashboard
Metric Explorer > All Metrics > Payment Transaction Breakdown > Add to Dashboard
II. Via Metric Explorer:
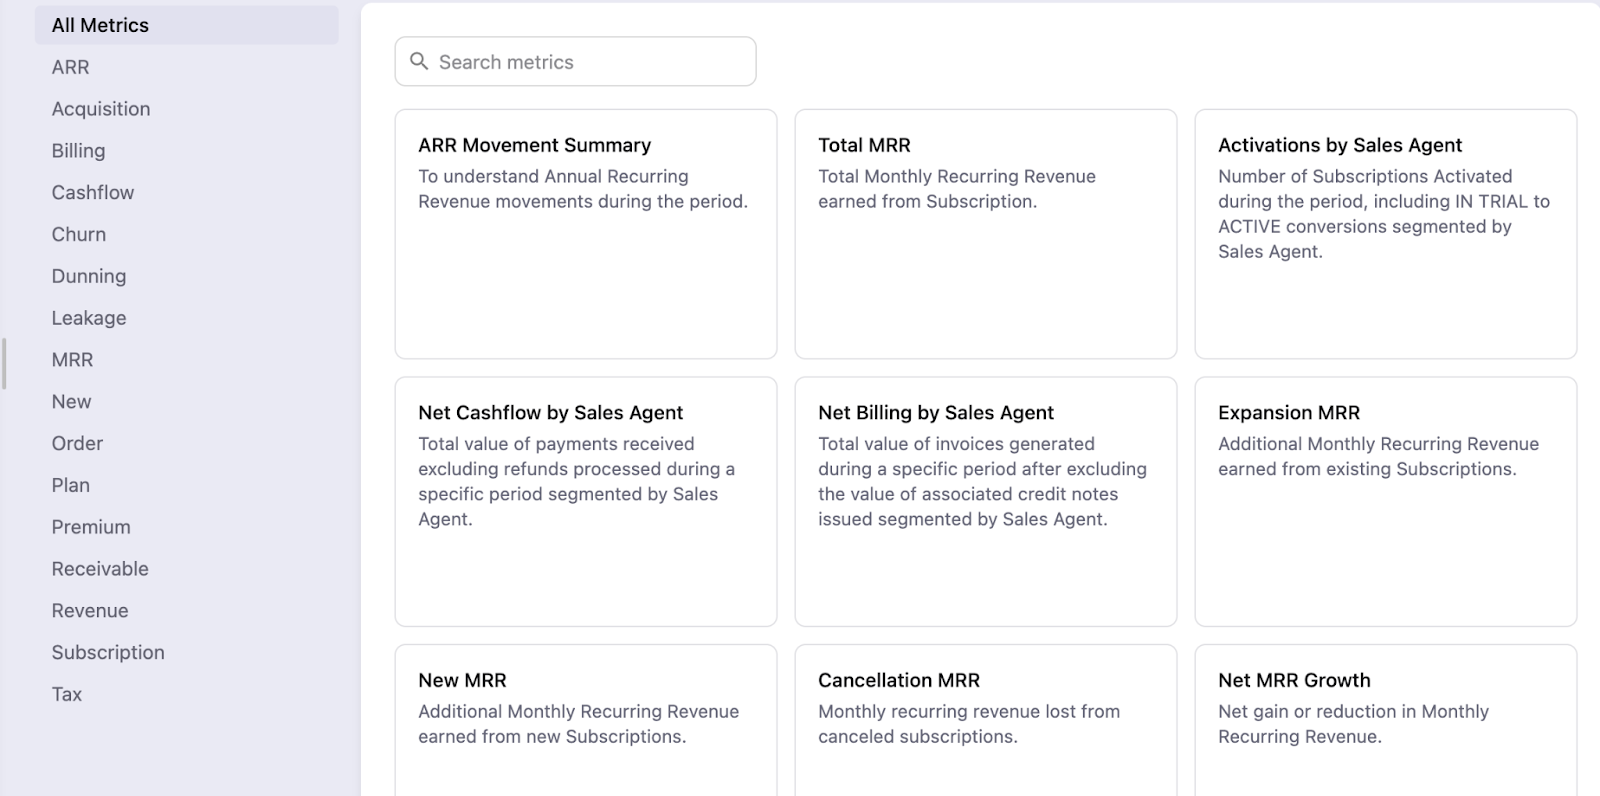
Chargebee has various in-built metrics that you can add to your dashboard. These metrics are available in the form of a KPI, Chart, Table, or Cohort.
Navigate from Revenue Story:
Metric Explorer > Cashflow > Recurring Cashflow > Add to Dashboard
Metric Explorer > All Metrics > Payment Transaction Breakdown > Add to Dashboard
Choose the time period for the KPI/Chart that you want to add. Click Add
The metric is added to the dashboard. You can re-position the metric by dragging and dropping it.
Alternatively, you can select and add the metric that you want into your dashboard from the Metric Explorer tab.
You can select any number of metrics that you want to add. Once done, click Add to dashboard.

Chargebee offers a wide range of interactive options for dashboards. You can apply filters, share, and download underlying data.
Applying Filters: You can filter your dashboard using the fields from Customer, Subscription, or Product resources.
To filter your dashboard:


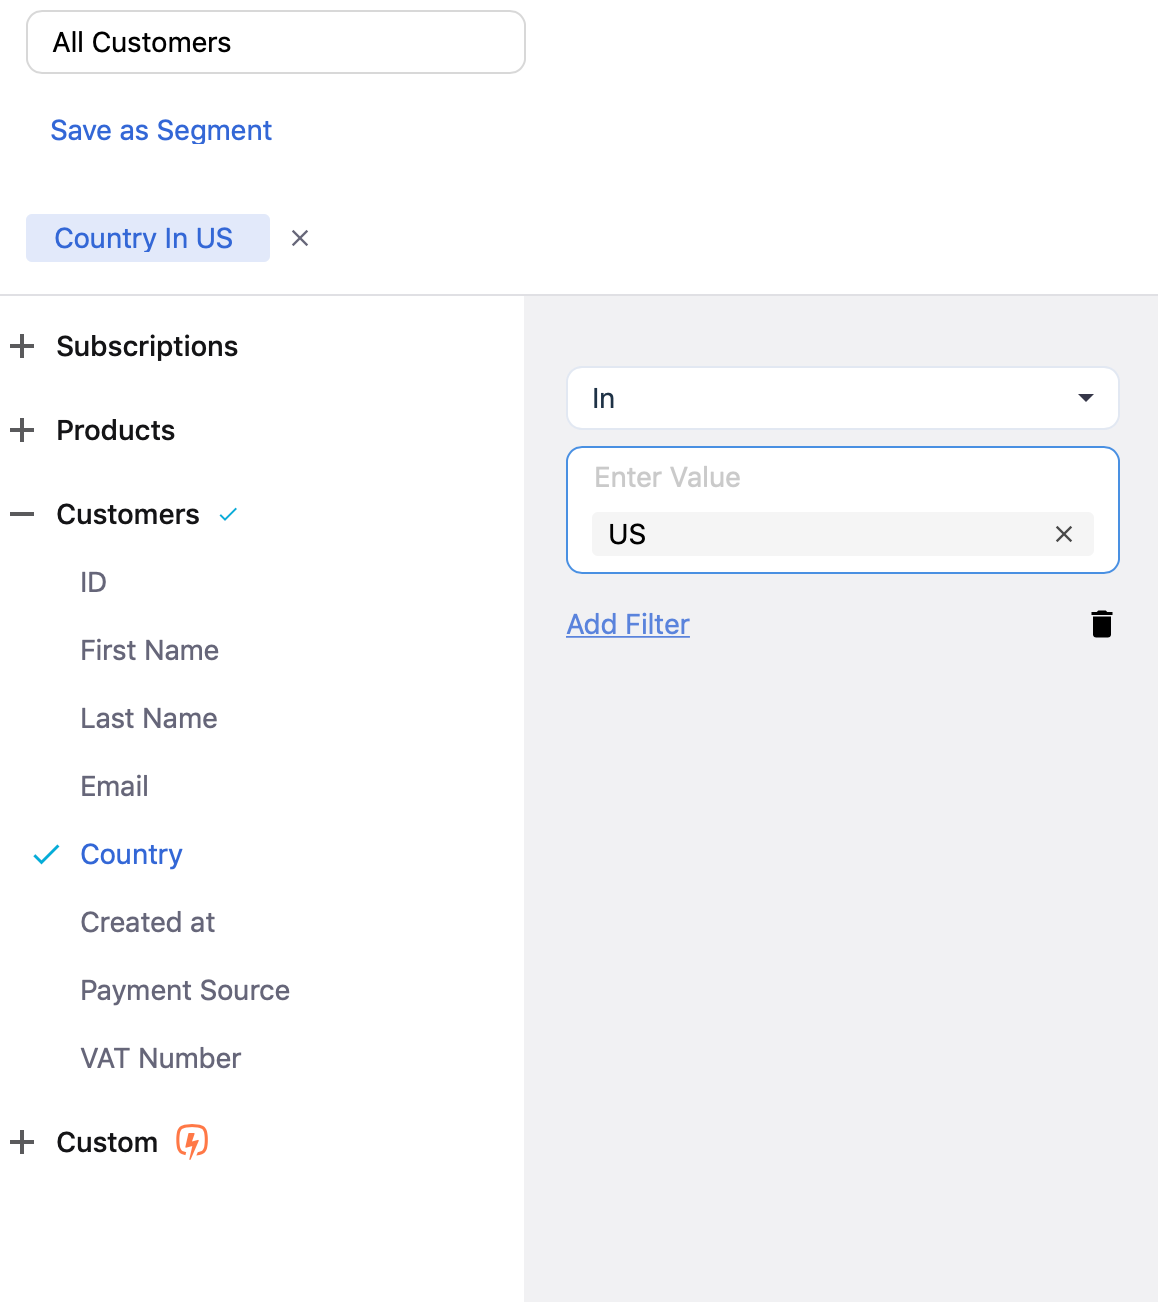
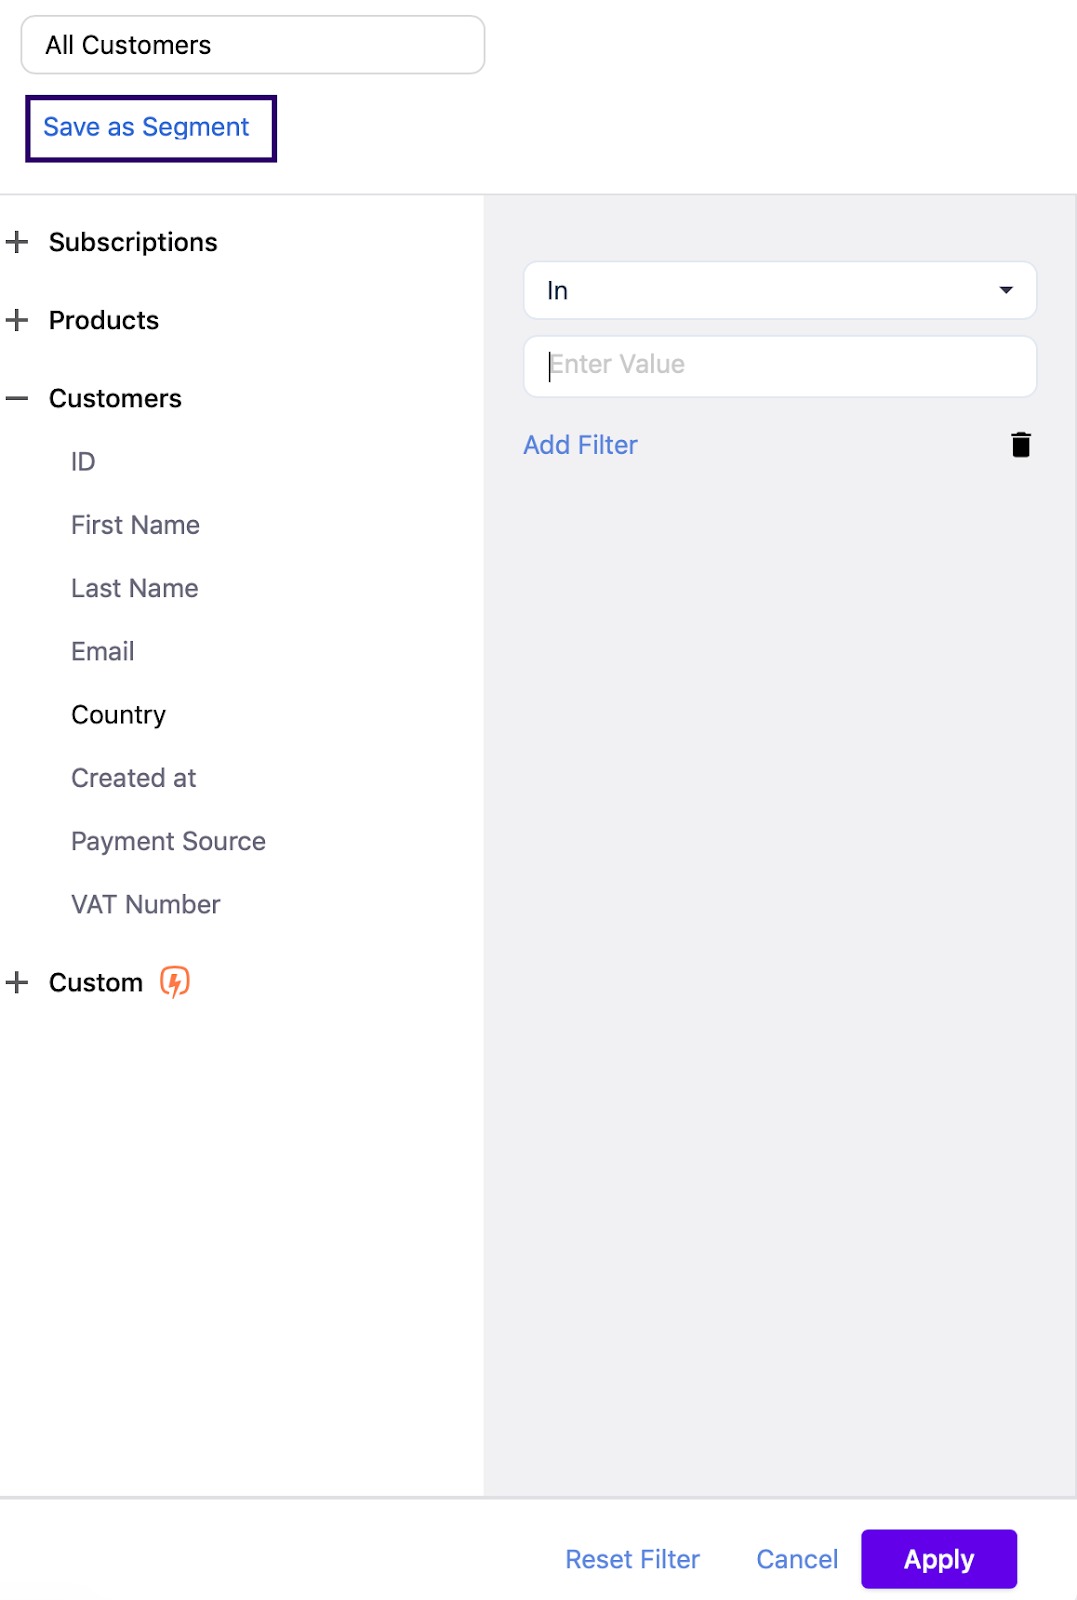
The filters will get instantly applied to the dashboard. If you want to save these filters for future use, click Save as Segment.
To know more about Metric Description


 Articles & FAQ