Businesses may have a large number of customers as well as financial data which requires team to collaboratively manage all their customers and maintain the cash flow so they never run out of money. Reports comes in handy for many aspects of business when you want to analyse the performance of your teams, collections, and account receivables data. Using the 'Reports' section, you can easily view and analyze the statistics of your AR data that gives you comprehensive details about your collections, customers invoices, and transactions.
Chargebee Receivables offers Reports that provide you clear visibility of your customers, teams, and financial data, so you can manage the AR/collection of your business effortlessly. Using the Reports, you can proactively view and manage the financial as well as CRM data at customer and transaction level.
An individual report helps you see the account receivables data, and identify the overdue invoices that need attention from collections perspective.

The Receivables Reports are summarized based on the following categories:
In Receivables, you can both view the reports and generate the report(Excel/CSV or PDF). The grid based reports allows you view and customize the report data.
The reports display the most essential data about your customer and transactions in the grid table. It allows you to keep track of the data related to your customers, invoices, disputes, financial activities, and collection performance in a table. The Grid reports in Receivables can be customized to show the exact data you need, and can be filtered and sorted to help you find the important data points related to your customer, disputes, transactions, and other financial activities.
The Grid based report allows you to perform the following actions:
Searching in AR reports: You can find all the relevant information about your customer's account receivables, outstanding invoices, visibility, document type, and more using the search bar on the top of the reports.
Advanced Filters: You can identify and control the information by applying filters to the grid reports. The Filter action helps you retrieve the most relevant data in the reports.
Generating email reports: In some cases, if the data is more complex to see in the grid view or if you want to share the consolidated report with others, you can generate an email based report. In a specific grid report, click the Mail icon to generate an email based report(Excel/CSV) that will be sent to your registered email address.
You can generate email report either once or schedule a report subscription (daily, weekly, or monthly) for custom reports that automatically send email reports to users or groups.
See Report subscription and configurations in Receivables.
Only specific user with download permission can generate the reports. Contact admin to enable this feature in your profile.
Receivables offers another set of reports that can be generated as an Excel/CSV file. You can download some specific types of reports based on a specific duration(date and month). In Receivables, you can generate the following reports:
The AR reports provides you the detailed report on the customer and all their outstanding balances, open invoices, and debit notes as of date. You can use the AR reports for number of reasons such as knowing when invoices are being overdue for a particular customer, balances, visibility across location, business unit, and all the other additional transaction details related to a customer.
The AR reports consist of the following reports:
The AR Master report makes it easy for you to get rid of the complex process for searching outstanding invoices customer wise and lets you drill down the information for a particular customer. It includes only the current outstanding and overdue invoices of your customers with due dates and payment status. Along with the invoice and transaction details, you can customize the view by adjusting the data columns and performing the actions available in Grid report.
To open the AR Master Reports, click to Reports > AR Reports > AR Master Reports(Outstanding Entries Only) to view the outstanding report for all your customers.

The AR Master Report(All) displays the consolidated report on entire transaction information related to customers including open, and closed invoices. The AR master Report(All) helps you view the current and previous outstanding invoices from all your customers. Along with the list of transactions, it also includes due date, document date, and other information corresponding to transactions associated with your customers.
You can also customize the default view of the AR Master Reports(all) by adjusting the data columns and performing the actions available in Grid based reports.
To open the AR Master Reports(All), click the Reports > AR Reports > AR Master Reports (All) to view the list of transactions including open and closed invoices for all your customers.
The following image displays the AR data along with the customers across location, business unit, and other visibility.

Businesses can have many collection activities that makes it difficult to manage the crucial information associated with customers, transactions, invoices, and collection data iteratively. You also need to gather and analyze the collection data to evaluate the performance of your business' collection processes. The Collection Activity Reports allows you to view, track, and analyze the performance of your business' collection activities and account receivables in one place.
It has several activity reports that make it easy for you to view and track the user performance, customer engagement, cases and disputes raised for your customers.
The Collection Activity reports consists of the following reports:
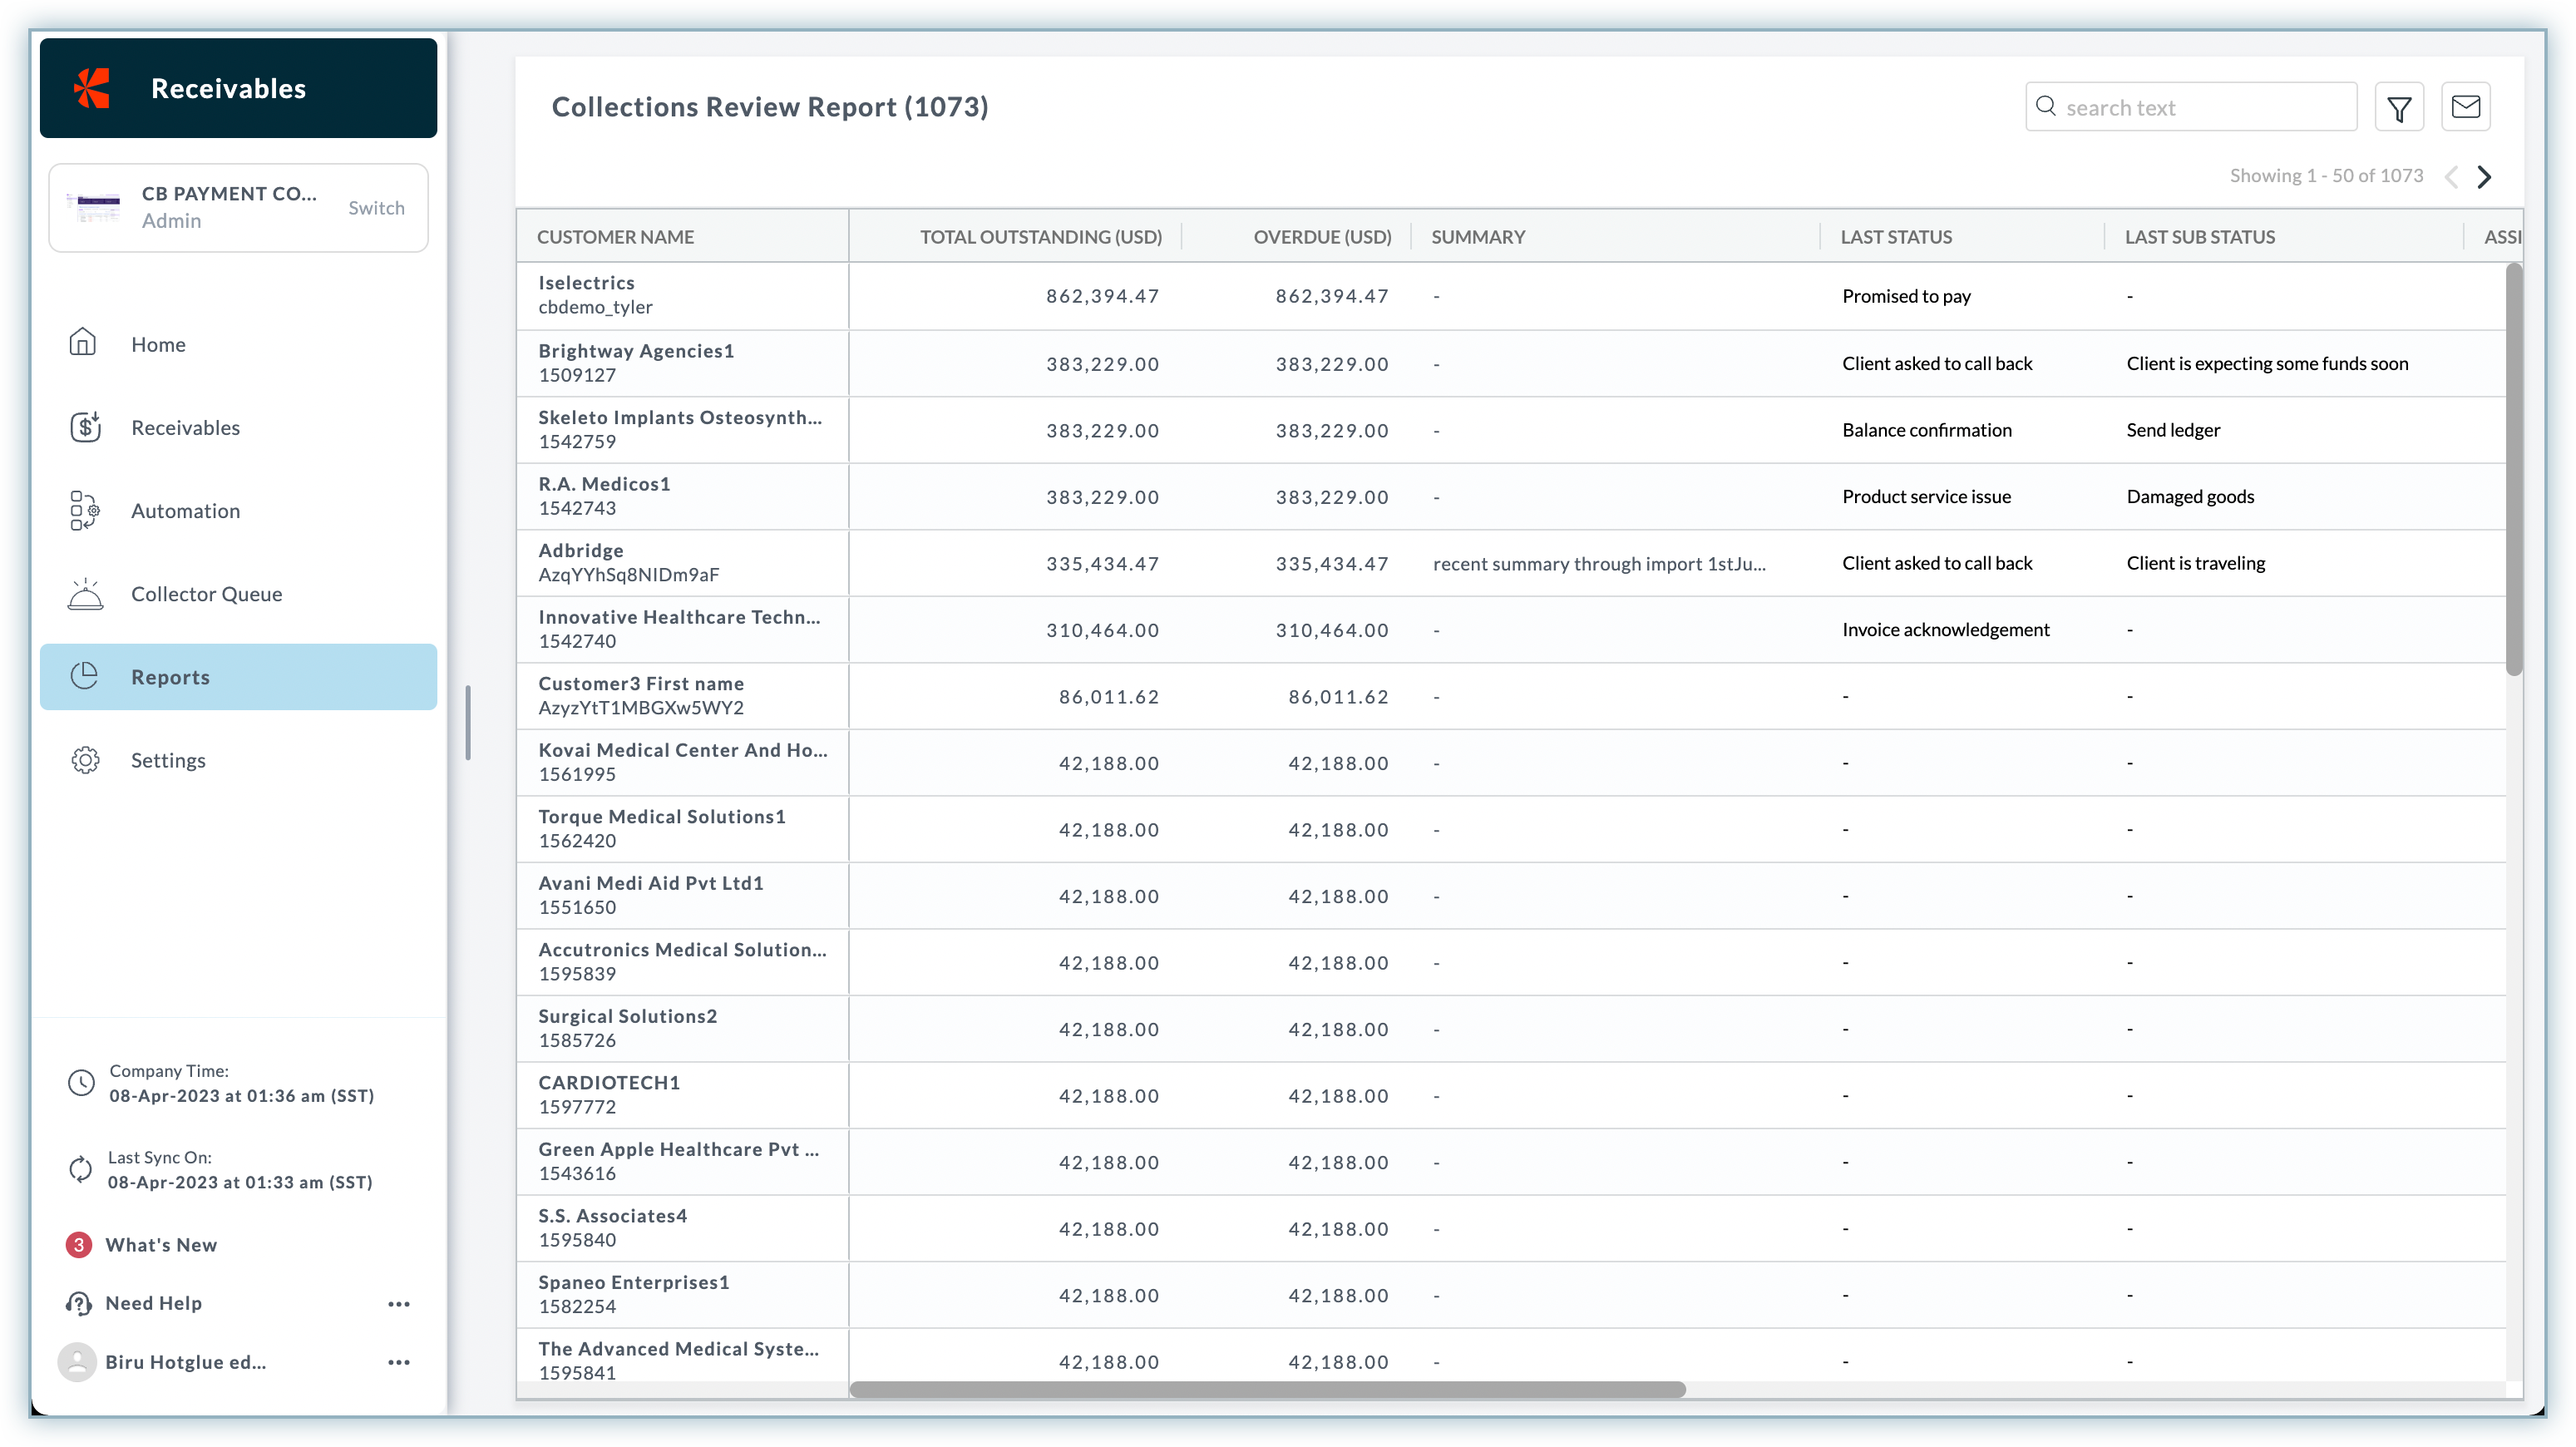
The Collection Review Report is a data-driven report which displays the detailed information on AR and collection data related to your customers. The report includes the CRM data as well as the financial data pertaining to your customers. You may use this report primarily to view, track and analyze the account receivables related data such as total outstanding amount, net overdue, promised to pay(if any), and other specific details related to your customers. The consolidated collection review report helps you monitor the collection status corresponding to each of your customers.
You can also customize the default view of the report by adjusting the data columns and performing the actions available in Grid reports.
To open the Collection Review Report-Customer wise, click Reports > Collection Activity Reports > Collection Activity Report-Customer Wise.

The purpose of this report is to help you identify and categorize the reasons why the money for a particular invoice is stuck. It also helps you estimate when the invoice will get paid. The Collection Review Report displays the list of invoices, and transaction activities occurring during a time period. It provides you summarized view of all the invoices/documents associated with your customers along with the document and due date.
In addition, the report may include the following information based on the documents associated with your customers:
You can also customize the default view of the report by applying advanced filter and slicing the report columns. To perform more actions on reports, see action in Grid reports.
To open the Collection Review Report-Invoice wise, click Reports >Collection Activity Reports > Collection Activity Report-Invoice Wise.
The following image shows the list of invoices/transactions created for all your customers along with documents types, transaction types, due date, and so on.

This report is useful for AR manager user persona.
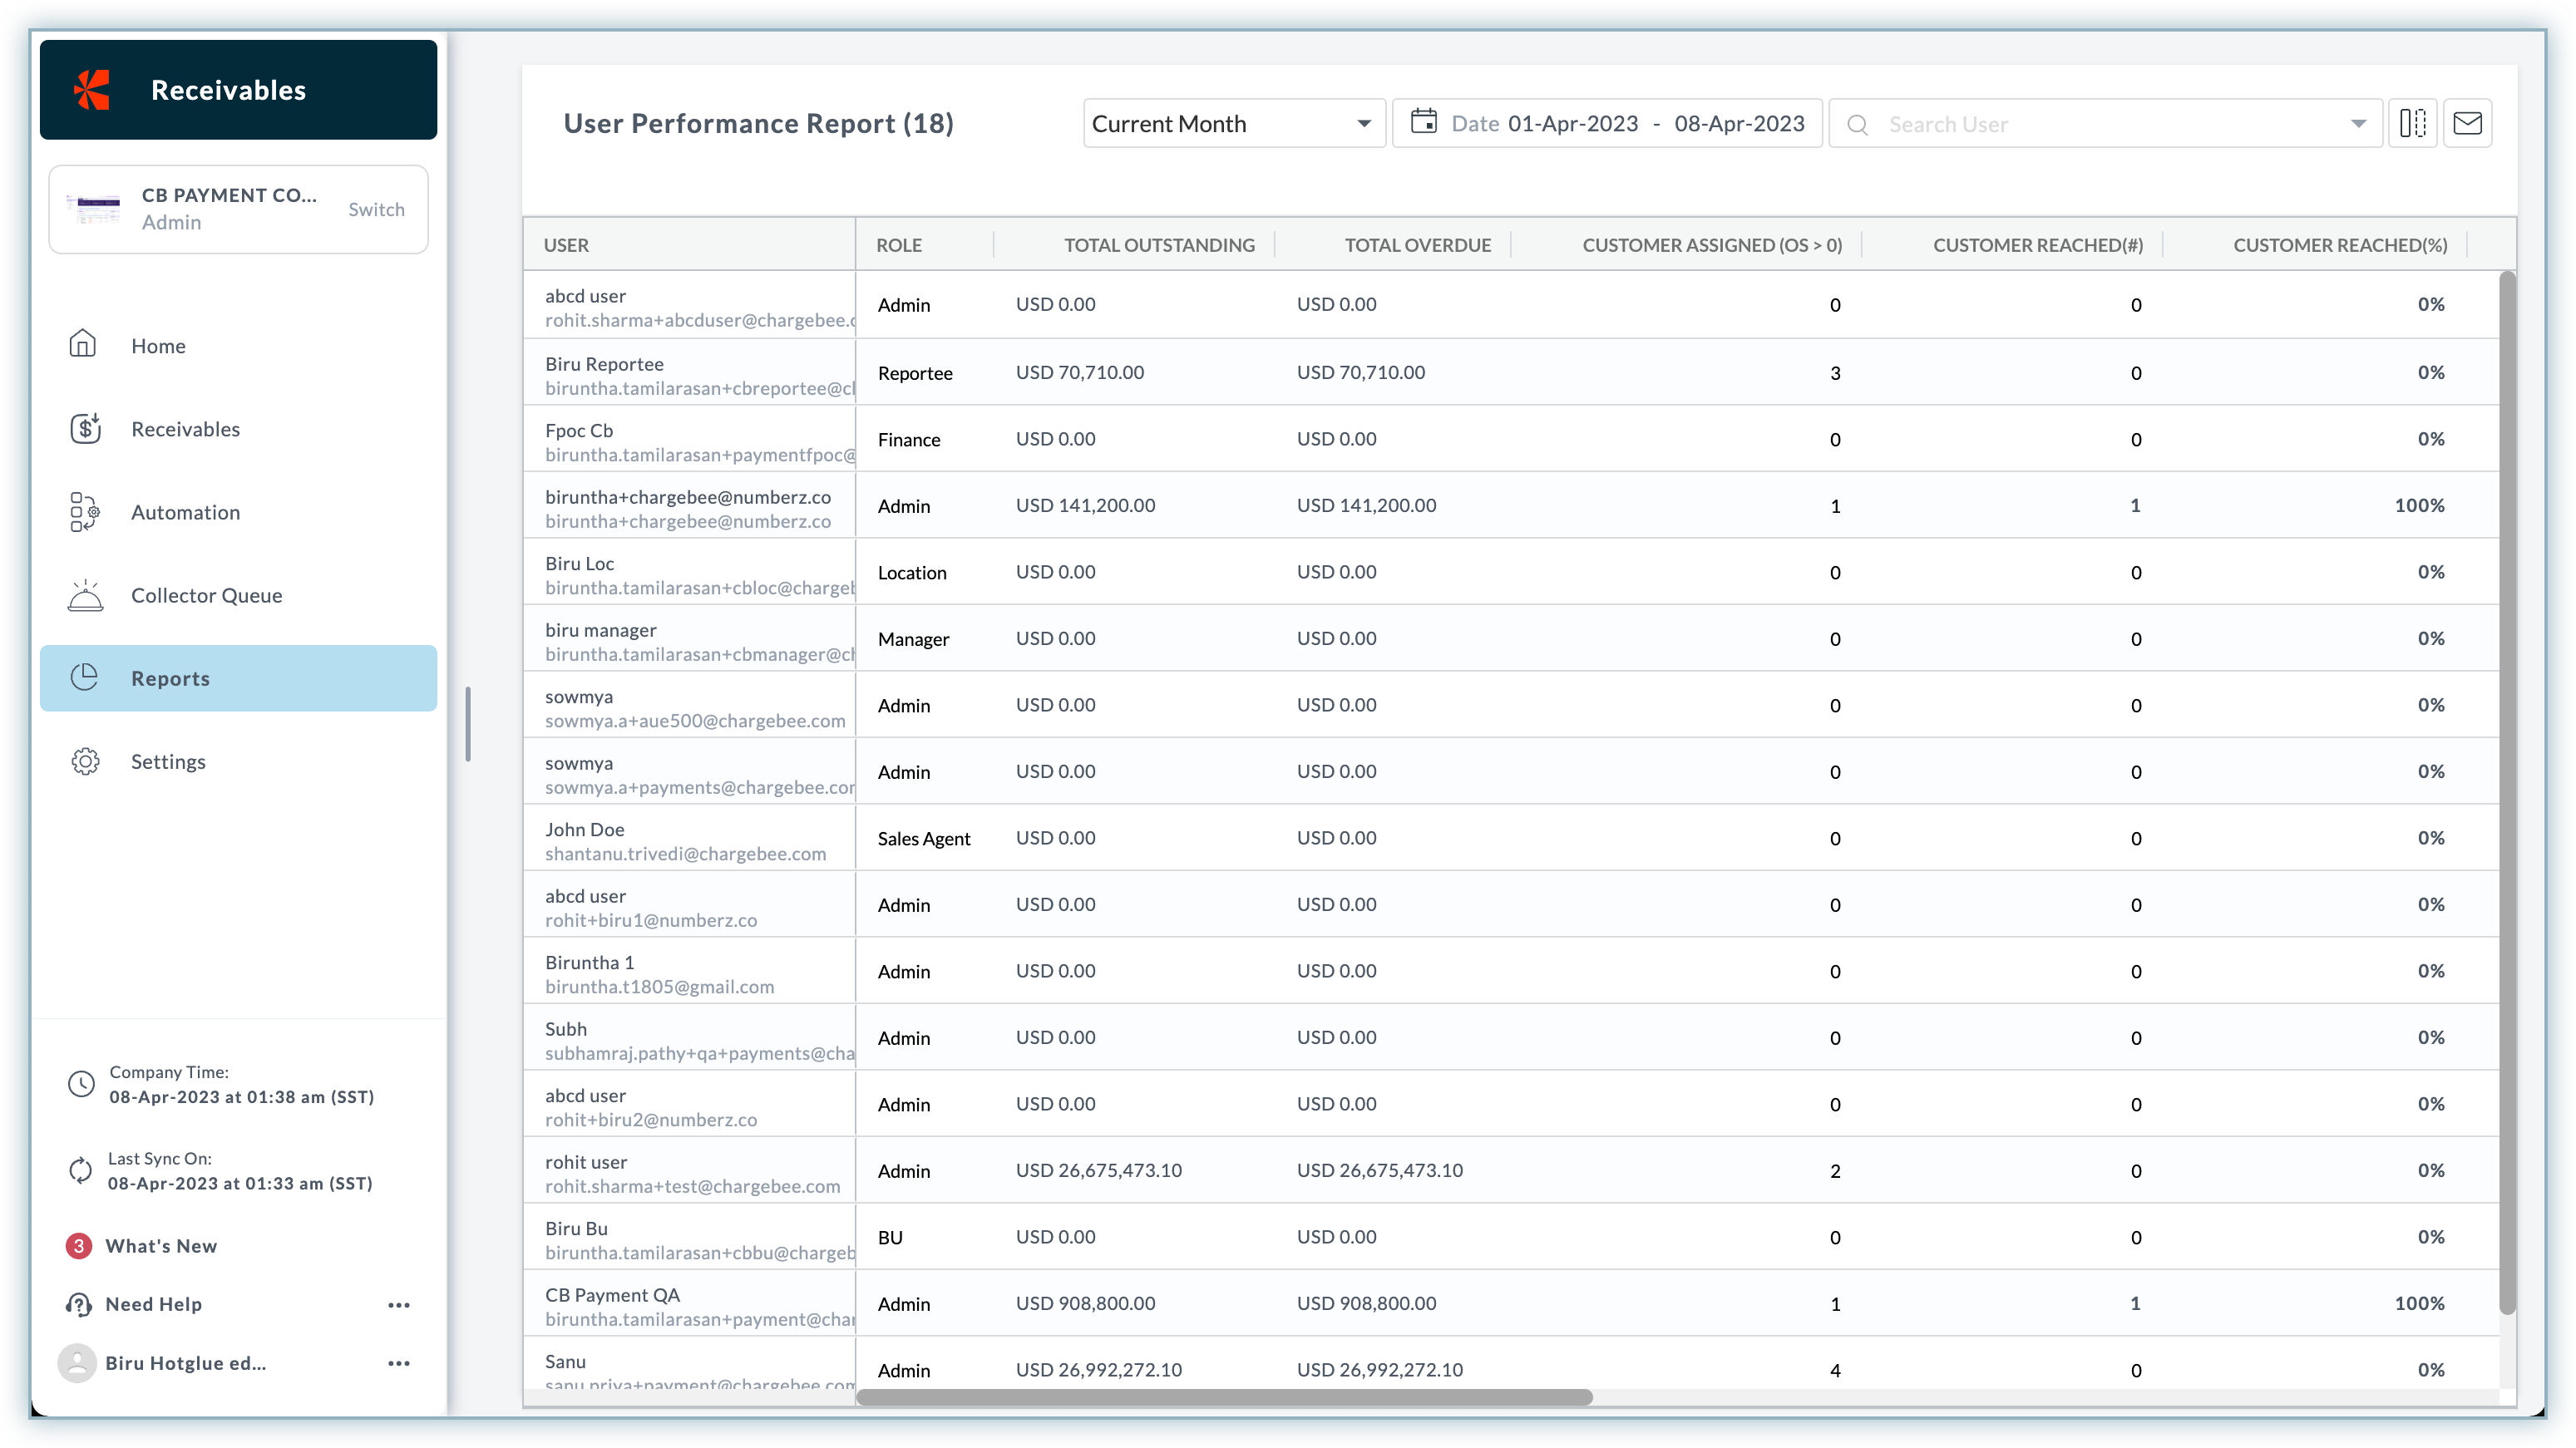
In businesses, it is important to periodically review the performance of your team members and evaluate how well they're following up with the cases and managing the account receivables for all the customers. The user performance report in Receivables allows AR head of the businesses to assess their user's collection activities for a specific time period. The report displays both Customer Relationship Management(CRM) data and financial data associated with users in the team.
The report provides flexible columns to display statistics such as user's role, total assigned customers, customer reached(in percentage), and data columns to show/hide specific details about the users. The report displays detailed user statistics, including:
Total Outstanding and Overdue amount.
Total assigned customers and customer reached(in percentage).
Overall associated case activities such as new, open, assigned, and closed cases.
Communication with customers (via email or SMS), and more.
You can customize the default view of the user performance report by adjusting the specific data columns and performing the actions available in Grid reports.
To open the User Performance Report, click Reports >Collection Activity Reports > User Performance Report.
A sample user performance displays the list of users and associated collection data.

Whenever a particular collection activity occurs, a case is created and queued in the collector queue dashboard. You can see all the cases created and assigned to you from the Collector Queue dashboard. Receivables offers Case Reports to help you get an overview of all the cases created and assigned to you.
It displays the list of all the cases along with the case properties and other details specific to a customer. The case report includes the detailed information about the cases including:
Total number of cases.
Case metadata such as case number, case status, case type, amount(if any), case overdue, creation, and deadline.
Customers associated with cases.
Contacted Date.
Communication mode(email or SMS).
Assignee Details (if any).
To open the Case Report, click Reports > Collection Activity Reports > Case Report.
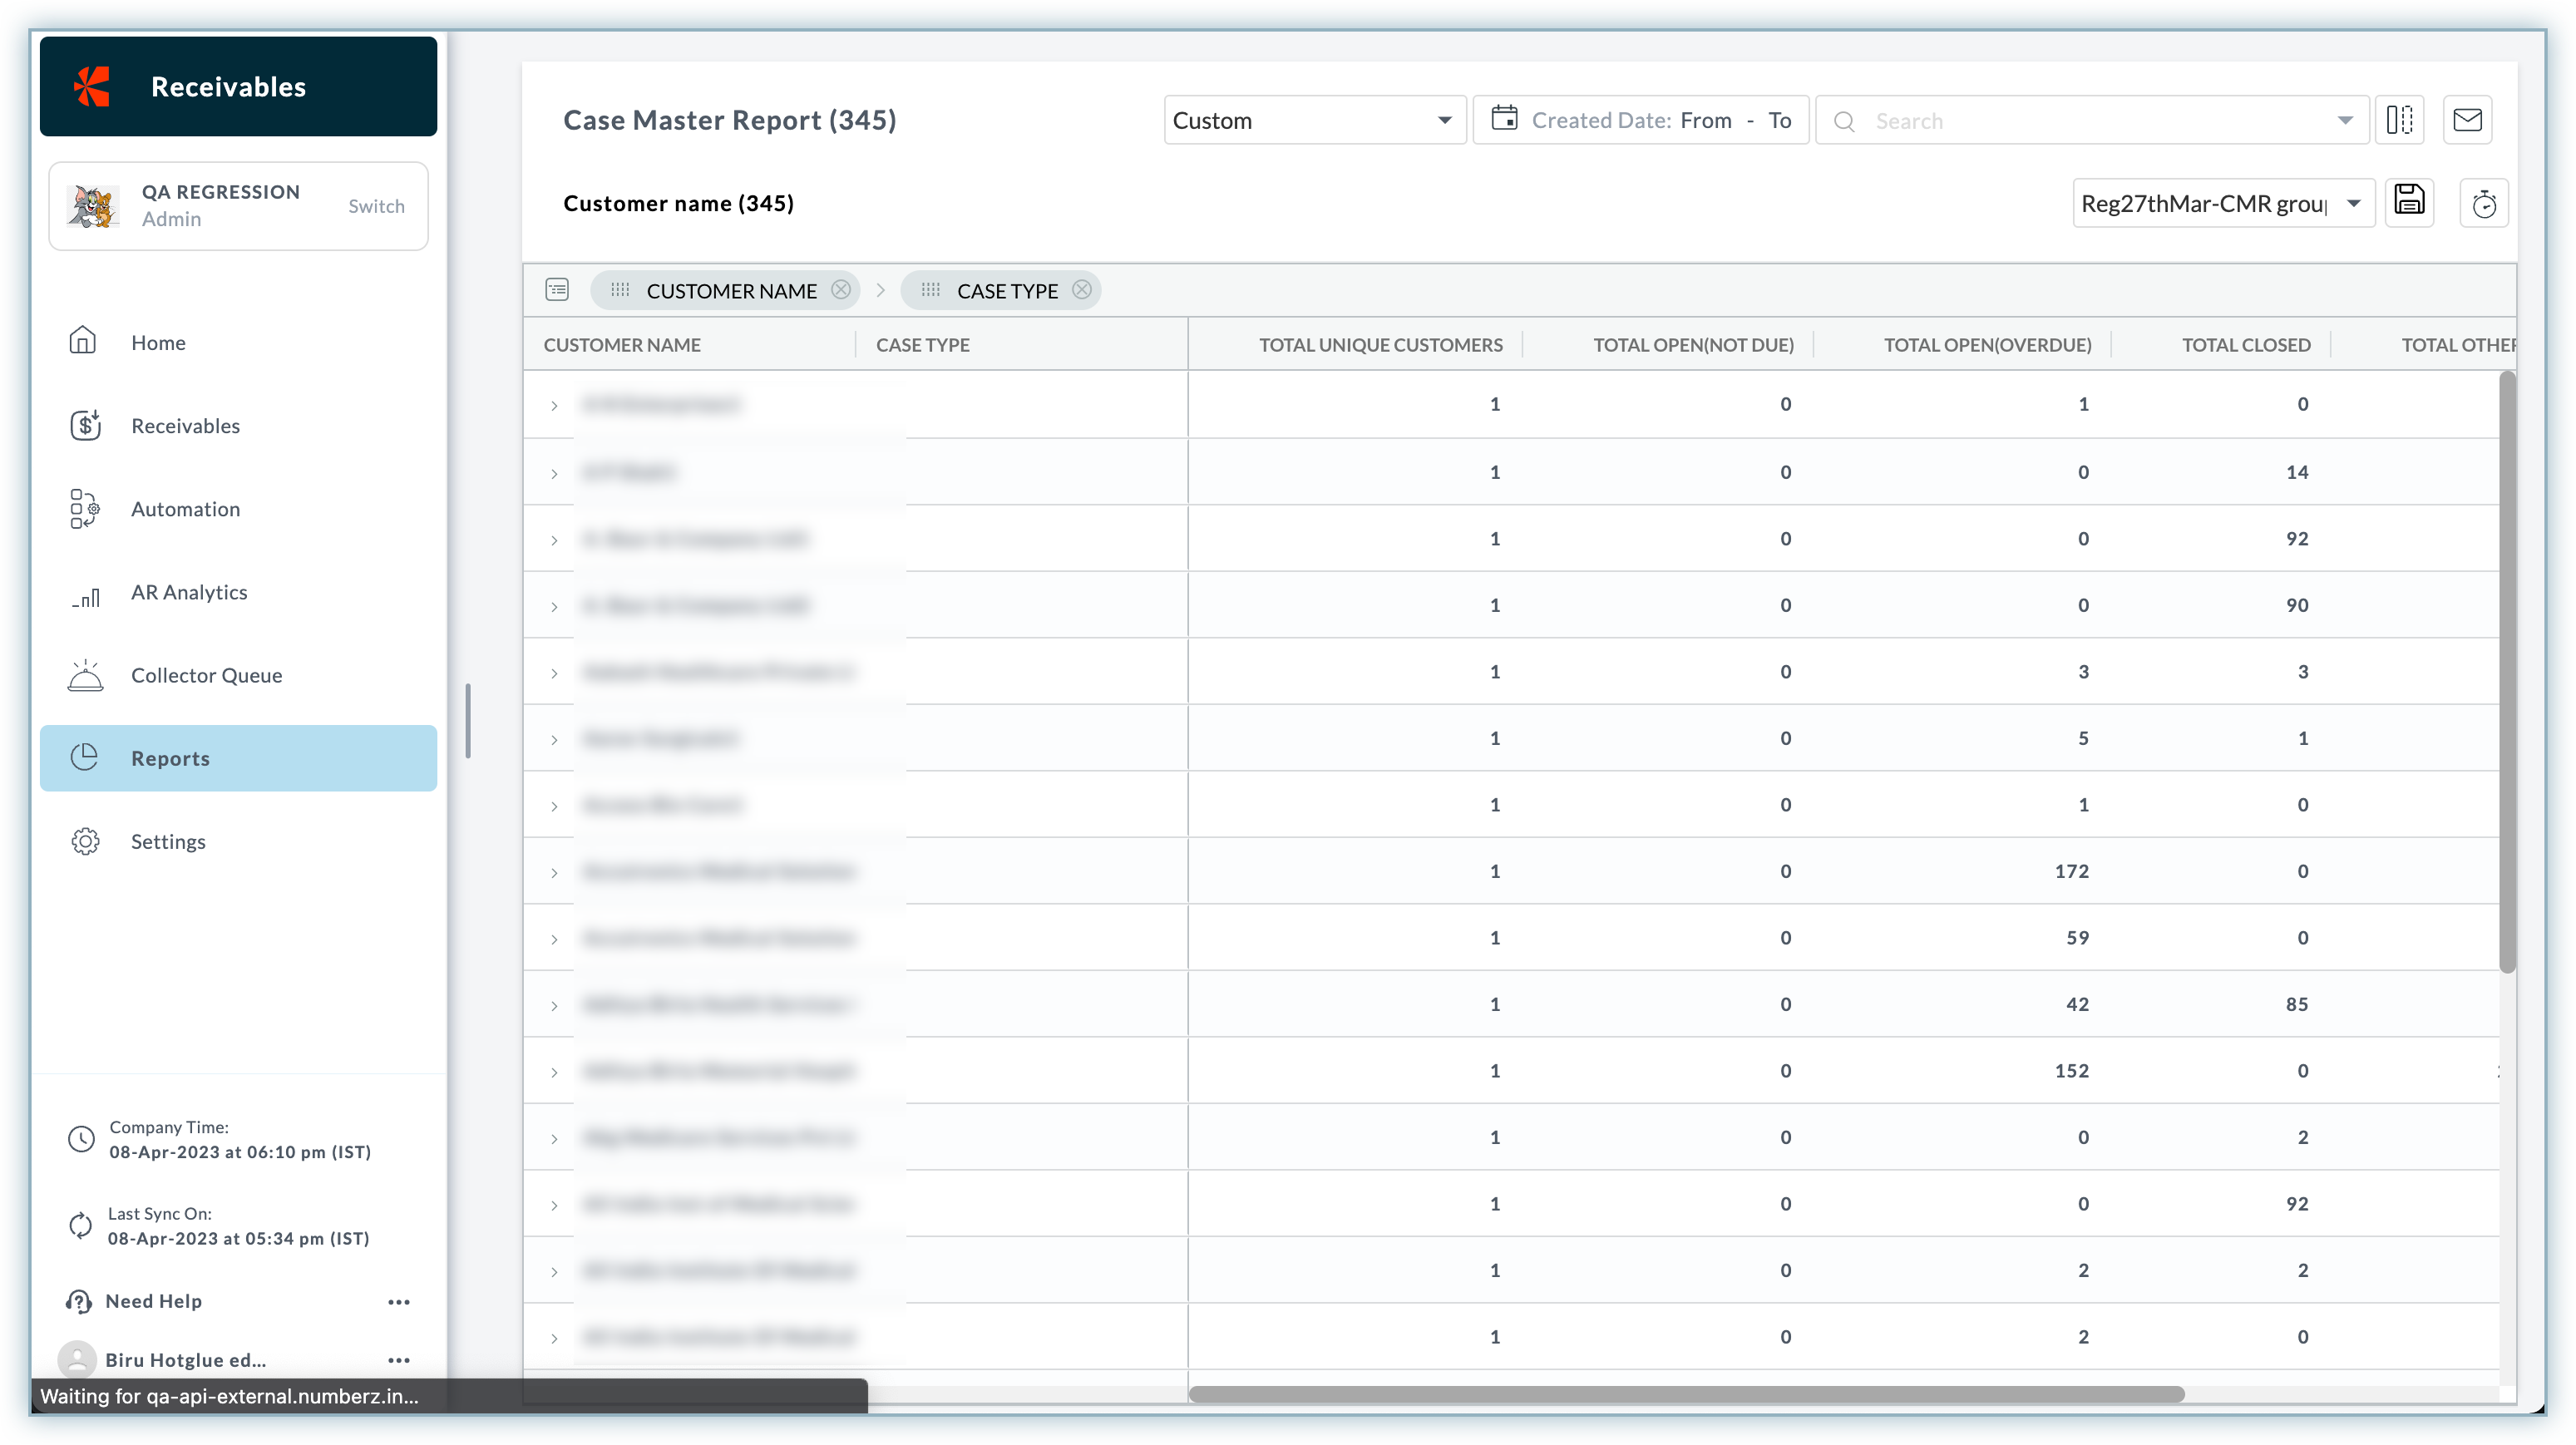
A sample Case Report display the list of cases with case details such as case types, assignee, customer name, customer code, and so on. You can also customize the view of the Case Report by adding/removing the data columns and performing the actions available in grid based reports.

With a high volume of invoices and large customer base, it becomes challenging for businesses to manage the entire collections process, customer's payment, and business cashflow activities. Cash flow forecasting is one of the underlying feature of Receivables that helps you understand the cash inflow and outflow of your business. It helps you ascertain your customer's payment behaviour, make smarter decision on future payments, and ultimately provides strategy to avoid unnecessary cash flow crisis.
The Cash Projection PTP Report displays the breakdown of the expected receivables that your customers has promised to pay(PTP) on a given period of time. It helps CFOs and finance leaders to understand when the payment needs to be collected from the customers to avoid running business out of money. It also helps them get an overview of how much money business is expected to receive from the customers at a given projected period. The report displays PTP Drill down report including the list of customers who have promised to pay the amount for their unpaid invoices in the projected day.
To open the cash projection report, click Reports > Collection Activity Reports > Cash Projection PTP Report. You can select the Projection Period column to get a detailed overview of all the invoices for which customer has promised to pay.

The following image shows the total PTP amount and list of customers who has promised to pay on a given projected period(0-7 days).

This report is available only to Indian customers.
The Online Payment Report contains details about the transactions that has been made by the customers via online payment method. It can be used to track payments made by customers as well as identify any fraudulent transactions. It provides you the detailed breakdown of payments that have been made by the customers through various payment modes such as, net banking, credit or debit cards, wallet, and so on. You can generate online payment report by selecting a particular month and date. The report helps you view, and track the customers who paid for their overdue and unpaid invoices via online payment method. It includes the information such as invoice number, payment data, and invoice amount.
To generate online payment report, select the date range and click Generate Report option. The report will be sent to your registered email address.
Chargebee Receivables enables you to unlock the experience of engaging your customers through running incentive programs, campaigns, reward points, offers, and more. Auto Engagement Cycle not only helps businesses to grow and engage more customer but also benefits in generating a solid Return on Investment(ROI). This report helps you measure the customer's engagement by showing follow up responses on email reminders, channels, sender, recipient and additional details related to email reminder sent to the customer.
To download a detailed client's engagement report for all email reminders in a given time period, follow these steps:
Go to Reports > Collection Activity Reports > Client Engagement-Email Report.
Select a specific day/month/year for which you want to generate the report.
Click Generate Report.
An excel file containing the email report is sent to your registered email address. The report includes a summary of all the email reminders sent manually or using auto engagement cycle to the customer for the given time period.
Important: The Client Engagment-SMS report is useful for businesses in India using the SMS reminders in Receivables.
Receivables provides reminder engine feature to remind your customers via email or SMS. Regardless of what channel you use to remind your customer, you can generate a consolidated report on SMS reminder. This report helps you measure the customer's engagement by showing follow up responses on SMS reminder, channels, sender, recipient and other additional details related to SMS reminder sent to the customer.
To download a detailed client's engagement report for all SMS reminder in a given time period , follow these:
Go to Reports > Collection Activity Reports > Client Engagement-SMS Report.
Select a specific day/month/year for which you want to generate the report.
Click Generate Report.
An excel file containing the SMS report is sent to your registered email address. This includes a summary of all the SMS reminders sent manually or using auto engagement cycle to the customer for the given time period.
Receivables provides many customization options that allows you to change the default view of the reports and retrieve specific data. You can customize the reports by applying advanced filter or by choosing columns to be displayed on the reports. The configuration options are only applicable to the grid based reports such as Receivables view report, collection activity report, and so on.
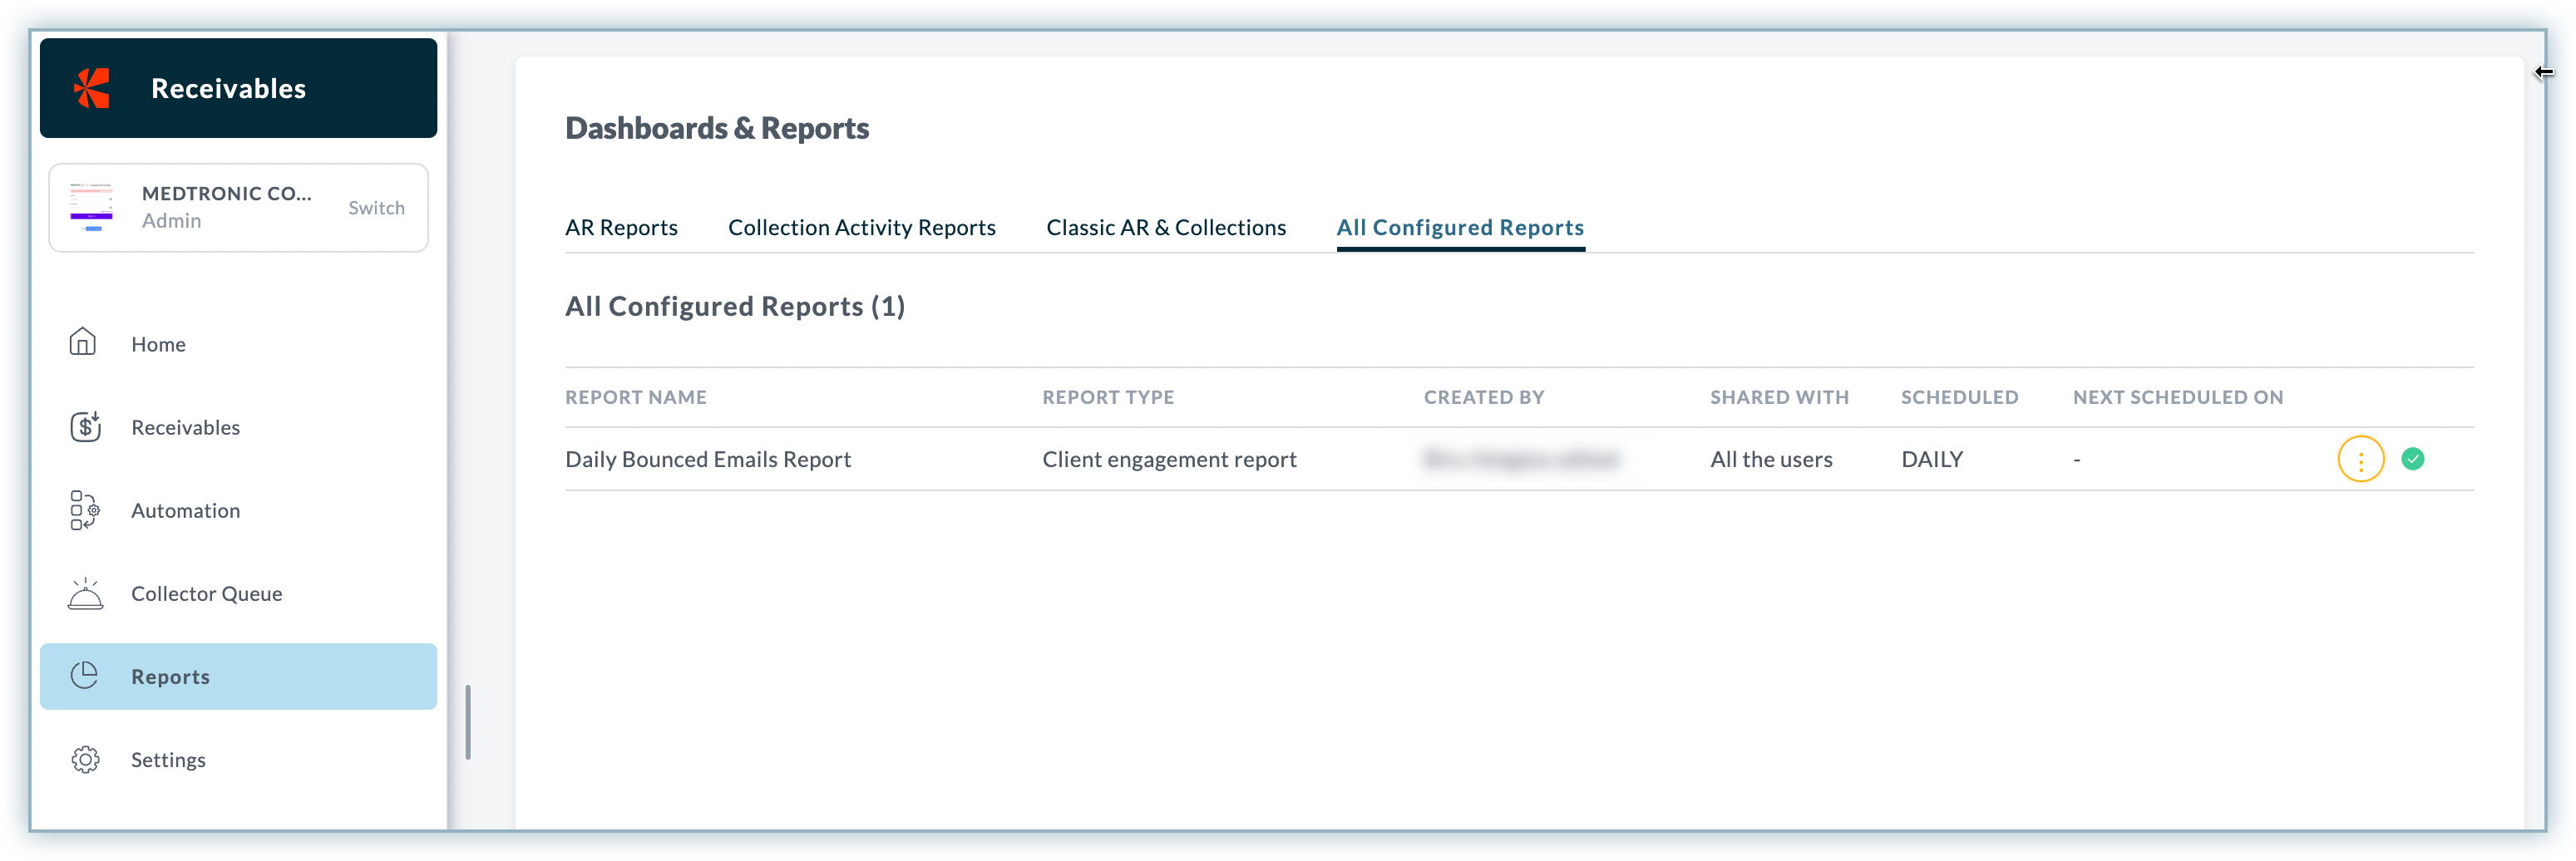
Once you have configured a particular report, you can save it as a new report by clicking the Save icon from the report dashboard menu. You can view and access all the saved reports from the All Configured Reports section in Receivables Reports.
To open the configured reports, click Reports > All Configured Reports.
The following image shows the list of all configured reports along with meta information such as report type, created by, shared with, and more.

You can manage the configured reports by performing the following operations:
Scheduling a Report Subscription: A Report Subscription service in Receivables is a configuration in Receivables that delivers the configured report at specific scheduled time and frequency such as daily, monthly, and weekly frequency.
To know more about scheduling a report subscription for a custom report, see Report Subscription and Configurations.
Deleting a configured Report: You can delete a configured report by clicking the Trash icon next to the report.
To know more about operation and managing configured report, see Manage configured Report.