As we transition into 2024, reflecting on 2023 events marked by rising interest rates, capital market challenges, and evolving customer behaviors, businesses are at a pivotal juncture. The past year’s trials have prompted a hard reset, compelling organizations to reassess their operating models for increased resilience.
The shift from the conventional’ growth at all costs’ mindset to prioritizing first principles is evident in this landscape. Chargebee’s 2023 State of the Industry Report underscores this shift, revealing that 87% of subscription leaders now consider customer retention as necessary, if not more important, than customer acquisition. Top-line growth is essential, too, but it has to be efficient.
As you enter 2024 with the theme of efficient growth and lessons from the past, here are five metrics that will be crucial for businesses navigating the challenges stemming from the events of 2023.
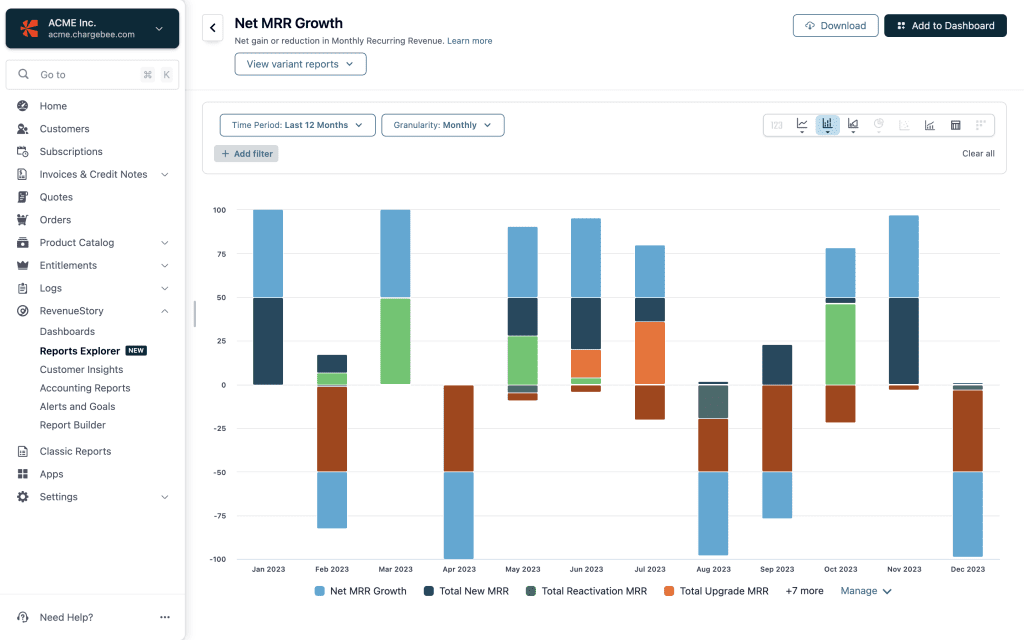
1. Net MRR Growth
What is Net MRR Growth?
It is the net change in monthly recurring revenue from one month to the next. Because of newly acquired money and revenue lost to churn, your monthly recurring revenue fluctuates from month to month. Net MRR Growth rate is a key indicator that aids in monitoring these fluctuations.
Why is it crucial for 2024?
When new growth is unpredictable and expansion from the existing customer base is harder, you need a metric that encompasses all these factors and gives your business an accurate pulse over time. Since Net MRR Growth includes both the positive growth contributors, such as new, upgrade, and reactivation MRR, and negative ones, such as cancellation, downgrade and paused MRR, it helps visualize the net gain or reduction in your Monthly Recurring Revenue (MRR) over time. In other words, it shows how stable your overall growth engine is.
How is Net MRR Growth calculated?
Net MRR Growth = [(New MRR) + (Reactivations MRR) + (Upgrades MRR) + (Free-to-paid MRR) + (Resumed MRR) ]- [(Cancellation MRR) + (Downgrade MRR) + (Paused MRR) + (Active to Trial MRR)]

Learn more about the industry benchmarks and how to increase your Net MRR Growth.
2. Average Activation Lead Time
What is the Average Activation Lead Time?
It is the average time taken for your customers to activate a subscription post signup.
Why is it crucial for 2024?
In an economy with frugal buyers with many choices and a saturated market, how fast you deliver value can be a huge differentiator. Activation lead time is a good measure of how soon your customers realize the value of your product or service.
Considering the broad spectrum of subscription and SaaS companies, landing on a universally good activation lead time is not simple. What looks like an excellent activation lead time for a pure-play Enterprise SaaS might be too long and a wrong benchmark for a PLG SaaS focusing on startups. But the goal here is to understand the behavior of your signups better.
This is a good way to measure its impact if you’re experimenting with ideas to reduce the activation or value realization time.
How is Activation Lead Time calculated?
Signup to Activation Conversions Breakdown = Total number of subscriptions segmented by the time taken for activation after signup
3. Net Dollar Expansion (NDE/NDR)
What is Net Dollar Expansion?
Net Dollar Expansion indicates how your active customer subscription base from 12 months ago has evolved now.
Why is it crucial for 2024?
One of the core tenets of the subscription revenue model is that once the cost of the acquisition (CAC) is recovered, the recurring revenue from the customers is a profit for the business. But as companies become frugal in procurement decisions and reassess current subscriptions, it becomes imperative to put your best foot forward to retain and expand within your existing customer base, as this dictates the future trajectory of your business.
This is where Net Dollar Expansion offers a reality check. Since it excludes new sales and only considers the growth trajectory from your existing customer base, it is a true test of your business’ mettle to navigate the tough economic conditions.
According to the 2023 Growth Benchmarks survey by SaaS Capital, companies with the highest NRR report median growth that is 2X the population median.
How is Net Dollar Expansion calculated?
Net Dollar Expansion = [(Total MRR during a period) – (Total MRR in previous period)]
4. Customer Lifetime Value (CLTV)
What is Customer Lifetime Value?
It is the average revenue you generate from customers over the entire lifetime of their account. Simply put, it is the money you make from a customer before churning.
Why is it crucial for 2024?
Monitoring CLTV offers two significant benefits: By knowing how much revenue you can expect from a customer, you can decide how much to spend acquiring them. And two, it helps understand customers’ behavior better and double down on specific cohorts of customers where you see an increased CLTV.
How is Customer Lifetime Value calculated?
CLTV = [(Average Revenue Per Paid Subscription) x (Paid Subscription Lifetime)]
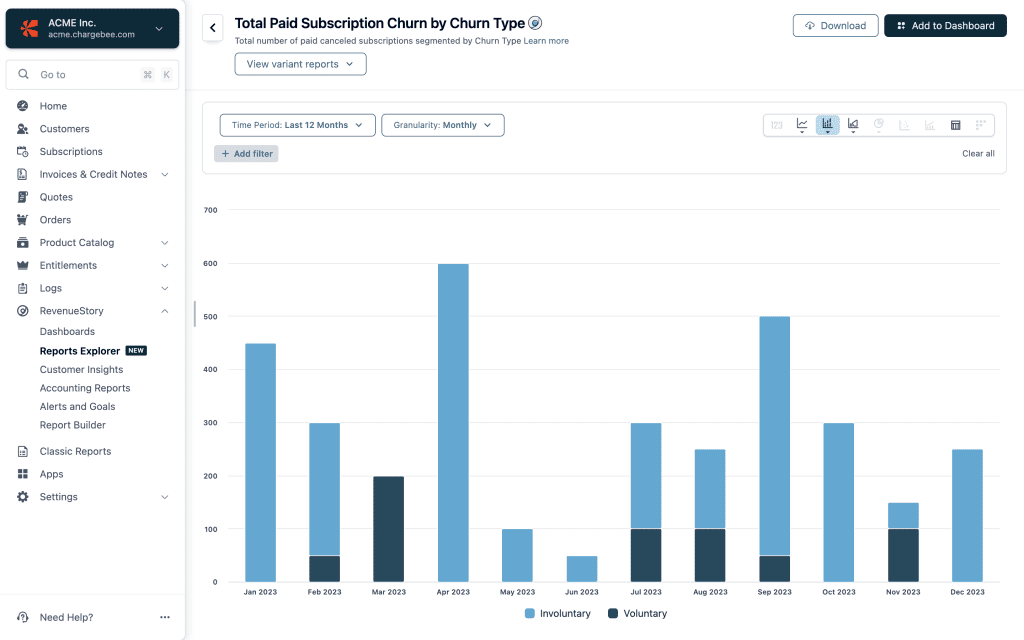
5. Paid Subscription Churn Rate by Churn Type
What is Paid Subscription Churn Rate?
It represents the percentage of canceled subscriptions across your paid pricing tiers.
There are two major types of churn — Voluntary and involuntary. Voluntary churn is when customers cancel the subscription because of pricing, non-satisfactory service, etc. As the name suggests, involuntary churn is not voluntary, wilful cancellations. They are caused by payment failures due to insufficient funds in your customers’ accounts, expired cards, etc.
Why is it crucial for 2024?
With all the emphasis on improving retention, it’s easy to get lost and view churn as one big problem. However, dissecting your churn to understand the underlying reason is prudent.
Not all churn is avoidable, but having this first level of clarity helps you address the avoidable churn on both fronts. While your Finance and Account Renewal teams focus on reducing payment failures (involuntary churn), your Customer Success, Product, and other teams can dive deeper and address the reasons behind voluntary churn.
How is the Paid Subscription Churn Rate calculated?

Paid Subscription Churn Rate = [(Number of Paid Subscriptions CANCELLED for a given churn type) / (Total No of paid Subscriptions at the beginning of period )] x 100.
Instead of getting lost in a vortex of SaaS metrics, you can count on these five as they inform you how soon your customers realize your value, how fast they grow, the ROI you get for your spend, where revenue leakage occurs, and how stable your overall revenue growth engine is.
Chargebee is the world’s leading Revenue Growth Management platform. Chargebee’s products help automate subscription billing, payment processing, and payment collections, improve retention, and gain a 360° view of your subscription business with insightful reports like the ones above.

