In these turbulent times, here’s a quick guide about what SaaS metrics and KPIs to track to stay ahead.
After an unprecedented bull run for 11 years, SaaS businesses are faced with a lot of uncertainty as they overcome the business impact of the global pandemic. While economists continue to debate on what shape the economic recovery will take, there is no fixed path ahead. The truths of each Monday are recaliberated by next Friday.
Forget about last quarter, what’s your next week looking like?
In the current scenario, agility is critical. You must look at the right leading indicators to make decisions quickly or risk getting buried under loads of data. While revenue metrics like LTV, CAC, NRR, and Quick Ratio are solid ways to diagnose long-term trends with respect to how the business is performing, it is important to look at the leading indicators of your revenue health, and act on them before they significantly impact growth and cash flows.
In this webinar, Vikram Bhaskaran, Sr Director of Marketing at Chargebee, talks about how to track and interpret the SaaS metrics and KPIs that matter during these uncertain times using Chargebee’s RevenueStory. If you can’t go through the webinar, fret not! I have summarized all the insights for you right here.
Reporting During Uncertainties: SaaS Metrics and KPIs that Matter
Let’s break down the key metrics to be monitored in three major categories. You can jump down to any of the specific metrics if you wish to:
- Growth and Diagnosis:
– Total MRR
– Total and paid subscriptions
– Net MRR growth
– MRR Retention Cohort - Churn and Mitigation:
– Gross MRR Churn Rate
– Subscription Pauses, Downgrades, and Cancellations - Leakage and Collections:
– A/R Aging, At-risk Revenue, and Revenue Recovery
– Revenue Leakage & Refund Impact
Growth and Diagnosis
This cohort of SaaS metrics helps you keep track of revenue growth through the changes in MRR and subscriptions.
Total MRR
Monthly recurring revenue (MRR) is the predictable recurring revenue earned from subscriptions in a particular month. MRR is a fair representation of the money your customers will be bringing in. You can read about the various components of MRR here.
While the global lockdown crippled verticals such as travel, hospitality, and sports; significant growth was seen by OTT streaming services (7x) and eLearning (3X) in terms of subscriptions.
For SaaS businesses (startup to scale-up), the weekly impact on total MRR is just starting to take shape. Businesses are unique in terms of what kind of customers they acquire, their pricing model, and retention. So it’s critical that they start the weekly analysis with the total MRR trend they have been seeing over the last few weeks.

A steady dip in MRR as seen in the graph is worrisome and the outcome of your customers’ changing priorities during the pandemic. You should focus on reworking your value proposition, pricing strategy, and ways to reduce involuntary churn.
Total and Paid Subscriptions
The second metric you should look at is your total subscriber base. If there’s a fall in paid users, it may be due to pricing and/or perceived value on your paid plan. You can consider reassessing the value proposition of your paid plans. Watch out for shifts in priorities amongst customers that impact your free tier as well. You can even make some premium features available to the free tier for a limited time.
Net MRR Growth
Of course, only looking at subscriber growth doesn’t always tell you the whole story. In normal circumstances, you might have some revenue churn, but the loss is mitigated by the new revenue and the expansion of existing revenue. You would use metrics like the SaaS Quick Ratio and Net Revenue Retention to understand the health of your revenue. Both these metrics are typically perfect to take stock of your revenue health.
But these are no normal circumstances.
Quick Ratio and NRR tend to flatten out minor, recent variances, which might be valuable lead indicators in the current scenario. But as the impact of the global pandemic unfolds, we need to look out for any changes in recent trends and Net MRR growth gives a visual breakdown of your revenue behavior month on month.
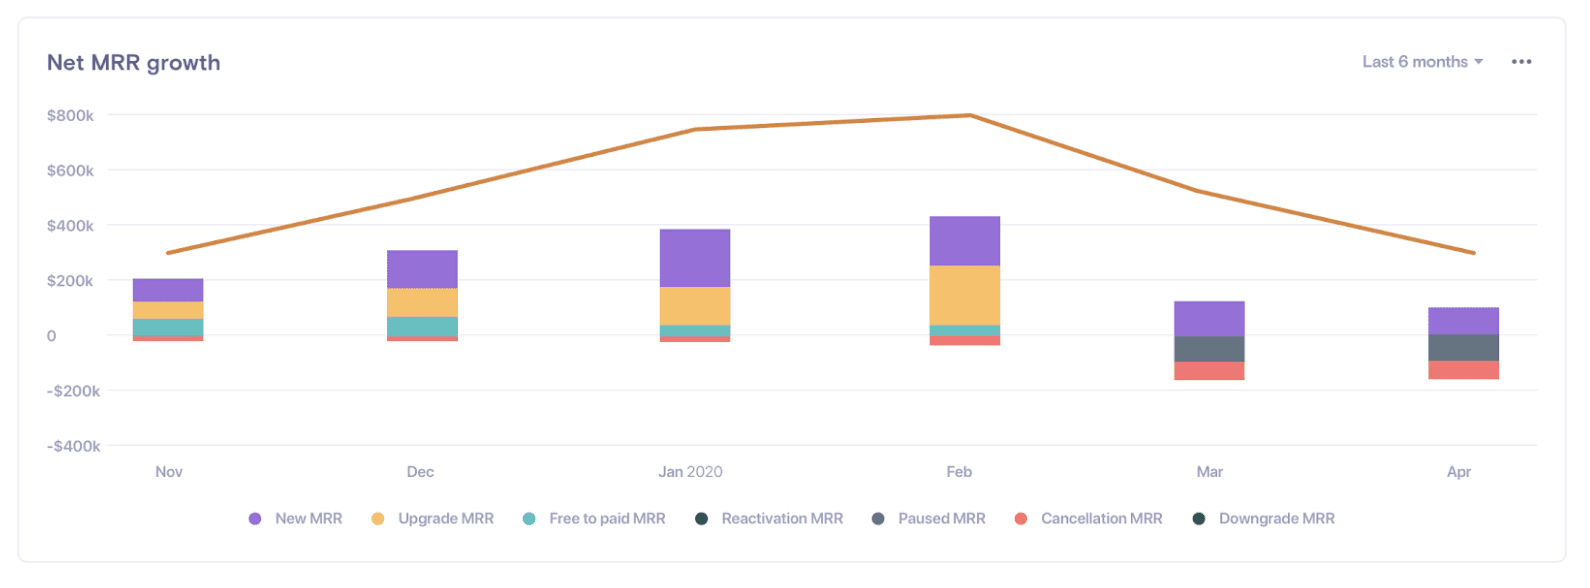
For instance, notice that the Net MRR trend allows you to spot the shrinking new MRR or an uptick in cancellations or paused MRR.
MRR Retention Cohort
The MRR retention cohort is an essential data visualization for you to analyze trends across dimensions. You can see the MRR addition, growth, and churn behavior based on both when you acquired the customer, as well as what happened in a particular month.
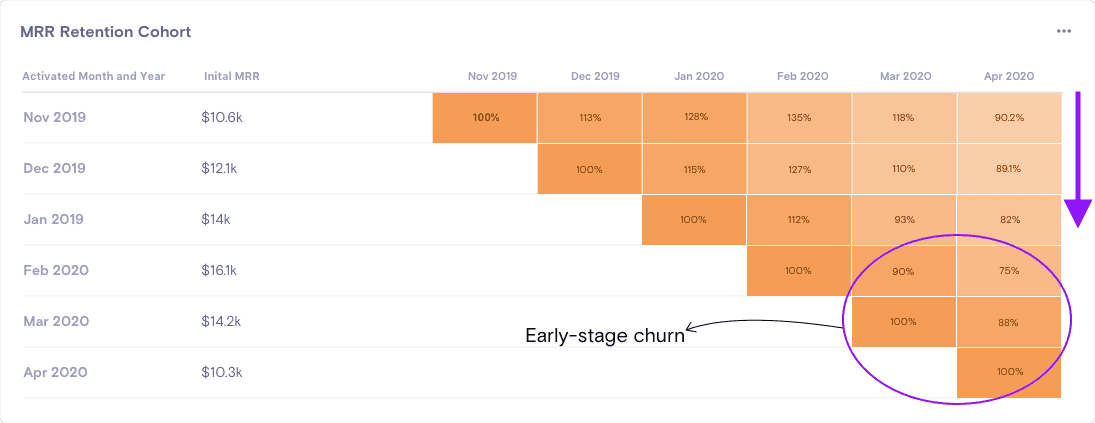
Moving down the first row shows you how much new revenue you were able to acquire month on month while moving across columns shows how much that cohort expanded or contracted. In the cohort above, observe that revenue trends in April were impacted across customers. But what’s more interesting is that customers acquired in the recent months seem to have churned more than the older ones – indicating a high early-stage churn.
The MRR retention cohort lets you explore the quantity and quality of customers, as well as see any changes in how long it takes them to grow or churn.
If you see a trend like the one in this chart, you’d want to now dive deeper into the dreaded C-word: Churn.
Churn and Mitigation
Churn is what every SaaS business’ nightmares are all about. Finding early signs of churn and mitigating it takes precedence in uncertain environments.
Gross MRR Churn Rate
When reporting churn, gross churn or the churn rate should give you an overall picture. But in this current scenario, though, it’s important that you report on both – so that you can zero in both the percentage increase in churn, as well as the dollar value lost to churning customers.

Next step: mitigation. Collect more details to add depth to the kind of churn you’re facing. Because different kinds of churn call for different kinds of mitigation plans.
– Early-stage churn: Focus on your sales practices. Are you overpromising and under-delivering? Was there an expectation mismatch?
– Late-stage churn: This could be because a recent plan/pricing change didn’t sit too well with your customers, or they’ve simply outgrown your product.
It’s still a bit too early to jump to conclusions. So let’s take a closer look at what our churn metrics are telling us.
Subscription Pauses, Downgrades, and Cancellations
Voluntary churn occurs when customers:
- Pause the subscription temporarily.
- Downgrade to a lower plan.
- Cancel the subscription.
When high-value customers try to cancel/downgrade/pause due to reasons such as cash flow, it’s important to earn their trust and ensure that they stay on for longer. Open up a few premium features for them. Or upgrade them to a higher plan free for the first 6 months. Show them you care.
Ideally, you wouldn’t want to see customers churning at all. But if they are, better pause than cancel. There’s some solace in revenue churn due to downgrades as well, since you at least get some revenue from customers. In this case, you might want to understand the reason behind their price sensitivity or value expectation and reassess your pricing & packaging structures.
On the other hand, you have involuntary churn. What if customers are churning due to payment failures and card declines? You can’t really blame your customer for forgetting to update their card details in this time, but it still affects your revenue. So it’s good to have dunning mechanisms in place to mitigate that.
Leakage and Collection
This group of metrics will help you maximize your revenue potential by identifying leaks and cracks in the revenue cycle.
A/R Aging, At-risk Revenue, and Revenue Recovery
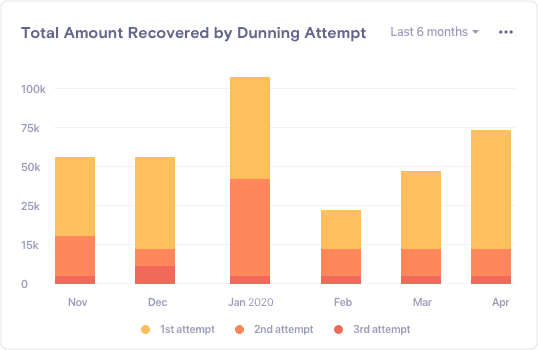
You should be proactively looking at at-risk revenue from customers whose cards are about to expire and revise your dunning strategy accordingly. If you don’t regularly A/B test your dunning emails and recovery schedules, now might be a good time.
The A/R aging report specifies the time period for which an invoice is outstanding. This is another data point you should be tracking week on week.
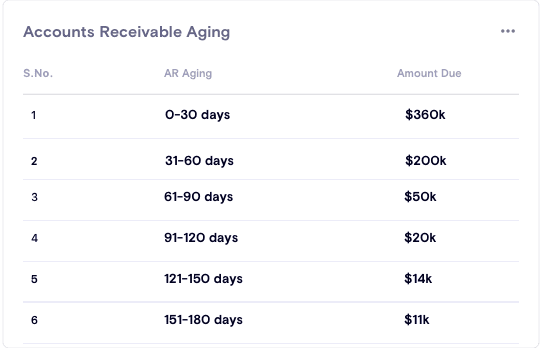
Given that most customers might be freezing their budgets, you might want to ensure that you close payments on your receivables sooner than later. On the other hand, we’re also seeing businesses with stronger cashflow positions offering more lenient payment terms up to Net-60 and Net-90 days to build a stronger rapport with their customers.
Revenue Leakage and Refund Impact
You should keep an eye on the impact of credits and refunds you’ve offered to customers. While churn is bad news, refunds are even worse since they impact cash already in the bank. Some businesses are re-structuring their refund policies to only offer credits at this time, but not offering refunds to an irate customer can only hurt your brand more. Look into the merits of each refund and process it on a case-by-case basis.
Closely tied is the impact of coupons and discounts. Discounts are a great way to retain customers and continue running the sales machine, but you need to be watching its impact on revenue.
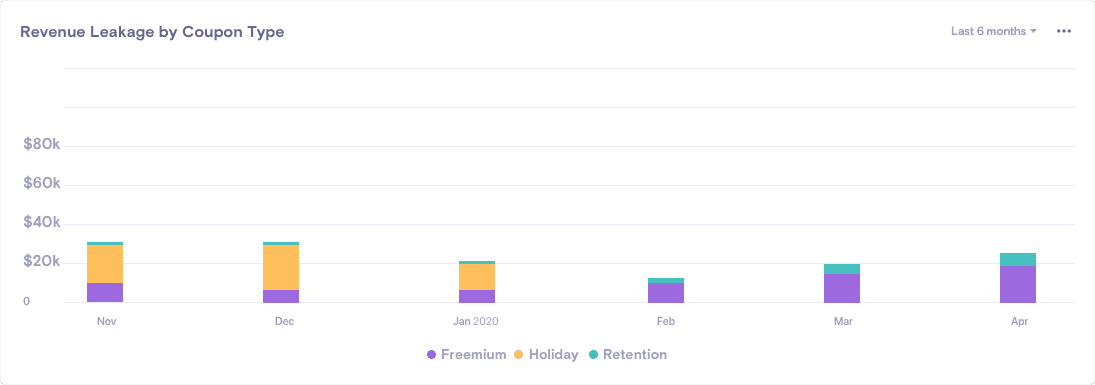
You don’t want to be in a situation where the sales team is closing seemingly big numbers, but all the heavy discounts gnaw away your total MRR.
Actionable Tips to Mitigate and Grow
You now know what to measure and what to make out of it. Here are some more useful tips to help you weather this storm:
- Operational Rigour: Review your revenue operational metrics week on week.
- Define Task Forces: Define cross-functional groups to drive rapid execution on trends.
- Monitor Leakage: Closely watch the impact of discounts on new and existing customer revenue.
- Capture Opportunities: Utilize Invoice notes, dunning strategy, and notifications to stay proactive.
- Reassess Packaging: Troubleshoot downgrades with customer feedback and value prop interviews.
- Publish Contingencies: Define cash flow, engagement, and revenue projections for the good, bad and ugly.
Tracking what matters will help you power through uncertainties. With Chargebee’s RevenueStory, you have subscription analytics at your fingertips. If you want to nail down on exactly what’s affecting your revenue and how you can mitigate it during the pandemic, try our RevenueMD tool here.
![SaaS Metrics and KPIs for COVID-19 Era [Webinar]](https://www.chargebee.com/blog/wp-content/uploads/2020/05/Reporting-in-uncertainties-Webinar-Blog-Banner.png)
