How’s your SaaS business doing right now?
Better than last year? Are your customers satisfied? Are your deals closing?
To answer those important questions about your performance — and to make sure your business is headed in the right direction — you have to track KPIs.
KPIs, or Key Performance Indicators, are metrics that quantify your team’s performance in specific areas. For example, you could track your monthly revenue or how many people sign up for your service.
There are a lot of possible KPIs for SaaS. It can be hard to know which metrics are important to which teams, how to find them, and how to take action on each one.
But KPIs are essential for getting a clear view of your current performance and for making business decisions that will help you reach your goals. So we’re here to help you understand all the important SaaS metrics.
Keep reading for a list of the top 32 SaaS KPIs you should be tracking.
Navigate to the section most relevant to you by clicking the links below:
Marketing KPIs for SaaS Companies
Marketing KPIs help you measure your marketing efforts and assess whether they’re helping you meet your business goals.
Here are the marketing KPIs that you should track.
1. Monthly Unique Visitors
Monthly unique visitors is the number of unique visits that your website has gotten over a set monthly period. It’s important to distinguish between “visits” and “unique visits.”
“Visits” are the number of people who visit your site. A single person can count as multiple visits if they return (e.g., existing customers who are returning to log in to their accounts).
“Unique visits” are the number of different people who visit your site, which is determined by their IP address. A person visiting multiple times over a given period is only counted once.
Why Should You Track Monthly Unique Visitors?
Tracking monthly unique visitors helps you measure your top-of-the-funnel marketing — activities that are focused on increasing brand awareness and getting visitors to your pages.
When you’re investing time and money into marketing your SaaS product, tracking the number of visitors you’re reaching can help you analyze how well your efforts are paying off.
How to Calculate Monthly Unique Visitors?
The easiest way to calculate monthly unique visitors is through a web analytics tool.
What Tools Can Be Used to Calculate and Track Monthly Unique Visitors?
You can track how many unique visitors your website is getting with a web analytics tool like Google Analytics. Once you create an account, navigate to “Audience” and click on “Behavior.” Then click on “New vs Returning.”
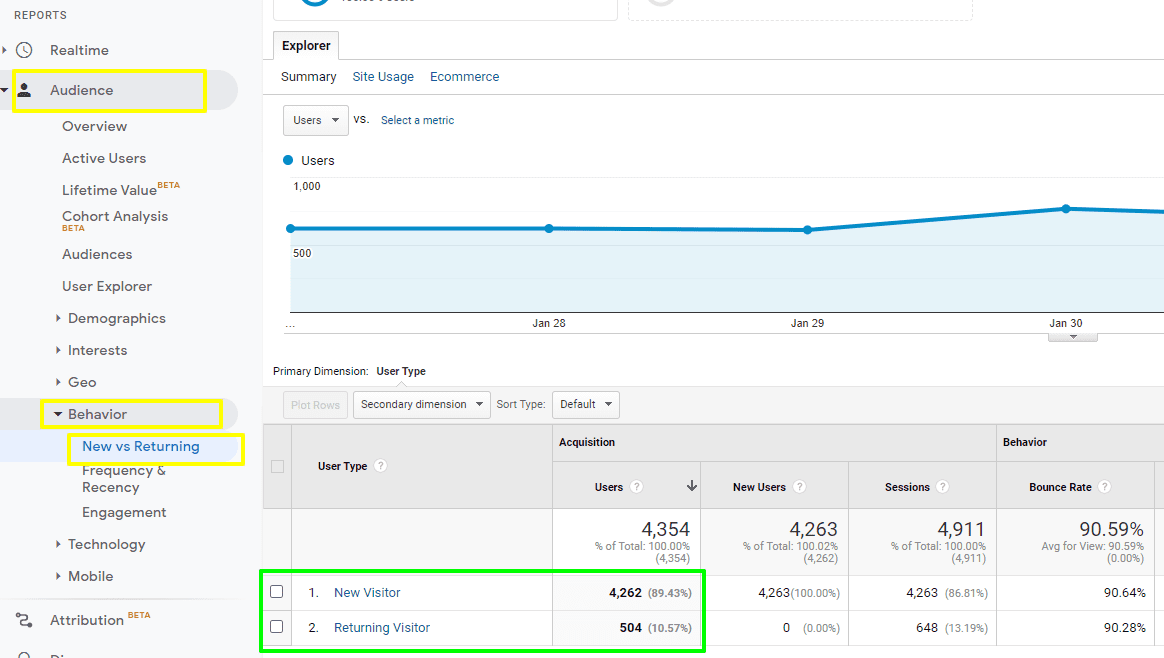
Google Analytics can also show you how those visitors are reaching your site (just click on “Secondary Dimension” then “Source”), which is useful for tracking which campaigns are driving traffic (and which ones aren’t).
4 Tips for Tracking and Increasing Monthly Unique Visitors
- Increase investment in those traffic-driving marketing campaigns like blog content, PPC and social media
- Use tools like Google Analytics to track monthly unique visitors.
- Take note of where your unique visitors are coming from, and double down on the campaigns that work,
- Check bounce rate, as a high bounce rate often indicates that visitors are leaving without engaging with the rest of your site. You can often decrease your site’s bounce rate by increasing the “related” content you offer on each page or by streamlining your sales funnel.
How to Interpret Monthly Unique Visitors?
An increase in monthly unique visitors is a good sign. However, if this metric remains flat or drops, it may be time to reevaluate your marketing efforts.
2. Signups
Signups refers to the number of people who sign up for your product in a specific time period.
Why Should You Track Signups?
One of the key goals of any marketing campaign is to drive more sales. However, prospective customers may want to sign up for a trial or freemium plan first to experience the product firsthand.
Tracking signups can help you test trial periods on your landing pages. For example, you may find that offering a longer trial without asking for a credit card results in more signups (though may increase churn).
It can also help you evaluate different marketing channels. For example, do you entice more people to sign up through paid ads or through email campaigns?
How to Calculate Signups?
Signups is a very simple metric — it’s just the total count of people who signed up for the product in a month, year, or whatever time period you want to track.
This number is more useful when viewed together with your traffic data. This tells you the signup rate, or the percentage of your website visitors that sign up.
To find your signup rate, divide the number of signups by the number of visitors to your website. Then multiply that figure by 100.
Let’s say that a marketing campaign drove 10,000 visitors to a landing page and 500 signed up for a trial. Your signup rate would be 5%.
What Tools Can Be Used to Calculate and Track Signup Rates?
You should be able to find signup data in your CRM.
As for signup rates, you can use Google Analytics or another analytics platform to track visitors to your website and combine that with your signup data.
Chargebee’s Trial Analytics suite also lets you view and track signup rates. You can even see conversions by plan, product, and more.
![]()
Tips for Tracking and Driving Signups
- Reduce friction in your signup process by focusing your visitor’s attention on a single signup CTA.
- Test different offers and trial periods.
- Track signup rates by acquisition channels, then double down on the channels that are delivering the best ROI.
- Track trial usage, to see if your trial users is converting to paid customers.
How to Interpret Signup Rates?
The average signup rate for SaaS free trials is 4.7%. If you’re much below that, focus on optimizing for signup conversions — experiment with trial periods, A/B test different headlines and copy, etc.
Track signup rate by channel and focus on the ones that drive the most signups.
3. Activations
Activations refer to the number of users who activate their subscriptions during a trial period. It typically occurs when users experience the value of a product.
Why Should You Track Activations?
When users sign up for a free trial, they’re evaluating whether a product fits their needs. But they haven’t had that “aha moment” that convinces them of its value.
A low activation rate suggests that users aren’t deriving value during the trial period — a sign that the user onboarding process needs reworking.
How to Calculate Activations?
Divide the total number of users who signed up for a trial by the number of subscriptions activated. Then multiple that figure by 100 to calculate activations.
Let’s say 100 people signed up for a trial period, but only 15 activated their subscription. The activation rate would be 15%.
What Tools Can Be Used to Calculate and Track Activations?
You can calculate and track activations by using a tool like Excel. However, keeping track of the number of visitors who actuated their subscription during a trial can be tricky.
Chargebee lets you track activations during trial periods. You can also track activations by plan and acquisition channel, allowing you to see which channels drive performance.
Tips for Tracking and Driving Activations
- More activations mean more revenue for your company, so focus on creating a welcome email sequence to increase activations.
- Train your customer success team to push signups toward activation in their support conversations.
- Help users derive value from your product during their trials by adding design elements to your dashboard that focus their attention on the tools that will most readily drive value.
How to Interpret Activations?
A high activation rate is generally a good sign. However, if there is a large gap between the number of users who sign up for a trial and the number who activate their subscription, you need to pinpoint where they’re dropping off.
Get feedback from your users and optimize your onboarding process. The key is to get users to experience the value of your product as quickly as possible.
4. Organic vs. Paid Traffic ROI
Organic traffic is traffic that comes to your site when someone clicks an organic listing (unpaid search result).
Paid traffic is traffic that you generate through paid marketing channels. Examples include paid search ads, social media ads, display ads, etc.
Organic and paid traffic return on investment (ROI) refers to how much revenue your company generates for each dollar you spend on your marketing efforts.
Why Should You Track Organic and Paid Traffic ROI?
Organic and paid traffic ROI can help you justify marketing spend, determine budget allocation, and evaluate campaign success.
How to Calculate Organic and Paid Traffic ROI?
Use the following formula to calculate ROI for paid traffic:
- ROI = (Revenue – marketing spend/marketing spend) x 100
Let’s say that a Google Ads campaign generated $50,000 for your business and the total marketing spend was $15,000. Your ROI would be 233%.
Calculating ROI for organic traffic is more complicated.
Track how much revenue your organic traffic generated and determine how much you’ve spent on your SEO strategy. Then use the same formula above to calculate ROI.
What Tools Can Be Used to Calculate and Track Organic and Paid Traffic ROI?
With Google Analytics, you can set up conversion tracking for your website. You can integrate Google Analytics with the SEO tool you use to track SEO rankings, such as SE Ranking, and acquire better insights regarding your website’s traffic in one dashboard. However, you’ll need to add the right conversion tags to calculate organic and paid traffic ROI.
Tips for Tracking and Increasing Organic and Paid Traffic ROI
- Ensure you’re using analytics tools and adding tracking pixels to your site, so you have full visibility of every marketing and advertising campaign you’re running.
- Compare your organic and paid traffic ROI against industry benchmarks.
- Calculate ROI for individual campaigns and track their performance.
- Optimize your marketing campaigns by implementing best practices to increase ROI.
How to Interpret Organic and Paid Traffic ROI
A great marketing ROI is 5:1, meaning that you earn $5 for every $1 spent. However, a good ROI will depend on factors like your industry, business model, and product.
Establish your own ROI benchmarks and set goals to improve them.
5. Viral Coefficient
Viral coefficient is the number of new users that your SaaS businesses’ existing users generate, typically through a referral program.

Why Should You Track Viral Coefficient?
Word of mouth is a powerful marketing strategy for any company. 93% of consumers trust recommendations from friends and family.
Tracking viral coefficient helps marketers measure and predict word-of-mouth growth. A positive viral coefficient is also a sign that users are satisfied with the product. Users wouldn’t recommend something they’re not happy with.
How to Calculate Viral Coefficient?
Multiply your current number of users by the average number of referrals that each generates and multiply again by the conversion rate of those referrals. Then divide that figure by 100.
Let’s say you have 2,000 users who refer two new users on average. If the conversion rate on those referrals is 5%, then your viral coefficient is 2. This means that for every new customer you bring in, you’ll gain two more.
What Tools Can Be Used to Calculate and Track Viral Coefficient?
You can calculate viral coefficient with Excel or Google Sheets. Simply add the calculation formula to your worksheet and enter the data from your referral program.
Tips for Tracking and Driving Growth with this KPI
- Aim for a viral coefficient of one or more to achieve viral growth.
- An increase in your viral coefficient indicates that your marketing strategy is working.
- Try to reduce the viral cycle time (the time it takes for users to invite others).
How to Interpret Viral Coefficient
A positive viral coefficient is a good indicator of your company’s overall success, because it correlates clearly to product quality. Improve your product and users are more likely to recommend it to others.
Of course, incentivizing your user’s referrals will also have an impact on your viral coefficient. But products that users love will be far more shareable than products users are sharing only to get the referral incentive.
6. Visitor-to-Lead Conversion Rate
Visitor-to-Lead conversion rate is the percentage of visitors who land on your website and are converted to leads. A lead is anyone who has expressed interest in your product and has provided you with their contact information.
Why Should You Track Visitor-to-Lead Conversion Rate?
Visitor-to-lead conversion rate helps you measure how effective your campaigns are at attracting the right audience (people likely to actually become clients or users). It also reveals how well your website generates interest and captures leads.
How to Calculate Visitor to Lead Conversion Rate?
Divide the number of leads captured by the total number of visitors. Then multiply that figure by 100 to get a percentage.
Let’s say that you get 10,000 visitors over a one-month period and 500 of them were converted as leads. Your lead conversion rate would be 5%.
What Tools Can Be Used to Calculate and Track Visitor to Lead Conversion Rate?
With Google Analytics, you can set up conversion tracking for your website and choose different actions from its lead categories (e.g., submit lead form, request quote, etc.).
When visitors perform those actions, they’ll count as a lead which you can track from your dashboard. You can even track these metrics by lead source or advertising channel.
Tips for Tracking and Driving Growth with this KPI
- Determine the actions that qualify a visitor as a lead (e.g., filling out an online form, requesting more information, etc.).
- Experiment with different marketing copy or design on your site and landing pages that encourage lead conversion.
- Measure visitor-to-lead conversion rate per marketing channel. Double down on the channels that (even if they drive fewer visitors) have the highest visitor-to-lead conversion rates.
How to Interpret Visitor-to-Lead Conversion Rate?
A high visitor to lead conversion rate indicates that your campaigns are attracting the right target audience. They’re taking certain actions that qualify them as a lead.
However, a low visitor to lead conversion rate indicates that you need to either focus on getting more qualified traffic or improve your landing pages (or both).
7. Customer Conversion Rate
Conversion rate to customer is the percentage of leads that convert into paying customers.
Why Should You Track Customer Conversion Rate?
Conversion rate to customer measures your effectiveness at turning leads into customers. It can also help you measure various marketing strategies to convert leads.
For example, if someone abandons their shopping cart before completing their order, you can follow up with an email and attempt to recover that conversion. You can also create a retargeting campaign to reach users who bounce from your bottom-of-funnel pages (pricing, case studies, etc).
How to Calculate Conversion Rate to Customer
Divide the number of converted leads by the total lead volume. Then multiply that figure by 100 to get a percentage.
Let’s say that your website brought in 100 new leads but only 5 of them became a paying customer. Your customer conversion rate would be 5%.
What Tools Can Be Used to Calculate and Track Customer Conversion Rate?
You can track customer conversion rate by using a CRM with lead tracking capabilities. This will enable you to track your leads across the sales funnel and calculate conversion rates.
How to Improve Customer Conversion Rate?
Conversion rates depend on various factors. However, anything from 2 to 5% is considered average. Follow the tips given below to increase the conversion rate.
- Improve lead quality to increase your conversion rates by focusing your campaigns on quality lead generation.
- Implement lead scoring so you’re putting the most time and energy into converting those leads most likely to convert.
- Segment your audience and refine your marketing strategy.
- Experiment with different offers and pricing strategies.
Sales KPIs for SaaS Companies
Sales KPIs are metrics that are used to track and evaluate sales performance. Measuring the right metrics will help you optimize your sales process and set your team up for success.
Here are the sales KPIs that you should be tracking.
8. Marketing-Qualified Leads (MQLs)
Marketing-qualified leads (MQLs) are leads that the marketing team has deemed likely to convert. This is determined by specific actions that a lead has taken (e.g., downloading an ebook, registering for a webinar, etc.).
Why Should You Track Marketing-Qualified Leads?
Tracking marketing-qualified leads helps the marketing team track and evaluate the quality of the leads they’re passing on to the sales team. It also helps marketing determine which type of content works best for different buyer personas.
Tracking the number of leads that become marketing qualified can help you determine if you’re attracting the right audience. If there’s a large gap between these numbers, work with marketing to refine your buyer personas and attract better leads.
How to Calculate Marketing-Qualified Leads
Divide the number of leads that you generated over one month period by the number of leads that the marketing team qualified. Then multiply by 100 to get a percentage.
For example, let’s say that your company brought in 500 leads and 80 meet the criteria necessary to be passed to the sales team. The percentage of leads that became marketing qualified leads would be 16%.
What Tools Can Be Used to Calculate and Track Marketing-Qualified Leads?
The easiest way to track marketing-qualified leads is through a CRM platform like HubSpot or Salesforce. These platforms enable you to set up a scoring system that moves a lead forward once they meet certain criteria.
Tips for Tracking and Increasing Marketing-Qualified Leads
- Define the specific criteria that a lead has to meet to become marketing qualified.
- Ensure your marketing and sales teams are in alignment when creating campaigns. This will save you from having to exhaustively qualify leads before they reach sales.
- Segment marketing-qualified leads by lead source to understand which channels deliver the best results, then double down on the ones that do.
9. Sales-Qualified Leads (SQLs)
A sales-qualified lead is a lead that has a high probability of converting. They’ve expressed enough interest in a product or service that they’re ready for a direct sales follow-up.
These are leads that have already been qualified by the marketing team. The sales team will then define them as sales qualified and work on converting them into a customer.
Why Should You Track Sales-Qualified Leads?
Tracking the number of leads that become sales qualified can improve your sales process and refine your lead scoring system. It can also help you measure how well your marketing team is qualifying leads before passing them on.
How to Calculate Sales-Qualified Leads
One metric you can track is the MQL to SQL conversion rate — the percentage of marketing-qualified leads that become sales-qualified leads.

Divide the number of sales-qualified leads by the number of marketing-qualified leads. Then multiply by 100 to get a percentage.
For example, let’s say you have 1,000 marketing-qualified leads and 150 become sales qualified. Your MQL to SQL conversion rate would be 15%.
The average MQL to SQL conversion rate is 13%.
A low conversion rate indicates that you’re qualifying marketing-qualified leads too quickly. In this case, work with sales and marketing to refine the criteria for the lead qualification process.
What Tools Can Be Used to Calculate and Track Sales-Qualified Leads?
Set up your own criteria that determines if a lead is sales-ready. Then you can use tools like HubSpot or Salesforce to calculate and track sales-qualified leads.
Tips for Tracking and Driving Growth with this KPI
- Segment sales-qualified leads by lead source to understand where your growth budget should be allocated.
- Use a sales automation tool or CRM to implement a lead scoring system based around A) Lead information they submit which signifies a high-value lead and B) Their behavior on your site or in your dashboard which signifies high intent.
10. Product-Qualified Leads (PQLs)
A product-qualified lead is a lead that has experienced the value of a product based on their usage through a free trial. These types of leads are more likely to convert than other leads.

Why Should You Track Product-Qualified Leads?
Marketing-qualified leads are qualified based on actions like opening an email and downloading a white paper. However, these types of leads are still early in the sales cycle.
In contrast, product-qualified leads are valuable because they’ve performed predefined actions within the platform (e.g., using a specific feature). These actions differ for every company, but they typically reflect the behavior of existing customers.
Tracking and organizing these leads enables your sales team to focus on leads that are more likely to convert.
How to Calculate Product-Qualified Leads
First, you’ll need to set specific criteria for product-qualified leads. Examples include number of features used, time spent within the platform, and usage frequency.
Take the number of users who meet these criteria and divide by the number of users who signed up for a trial. Then multiply by 100 to get a percentage.
For example, let’s say you have 500 users who signed up for a trial and 70 of them meet your criteria. This means that 14% of your trial users became product-qualified leads
What Tools Can Be Used to Calculate and Track Product-Qualified Leads?
You can use tools like Salespanel or Sherlock to score and track your leads based on in-product usage behavior. Once certain conditions are met, someone from the sales team can follow up.
Tips for Tracking and Driving Growth with this KPI
- Work with your sales team to find the actions that determine your PQLs, then make sure your CRM is tracking them.
- Revisit your onboarding process and talk to your customer success and product teams to implement communication and design that pushes users to generate value early on.
- Experiment with different trial periods to increase sign-ups and revamp your onboarding process to help users derive value early on.
11. Conversion Rates by Funnel Stage
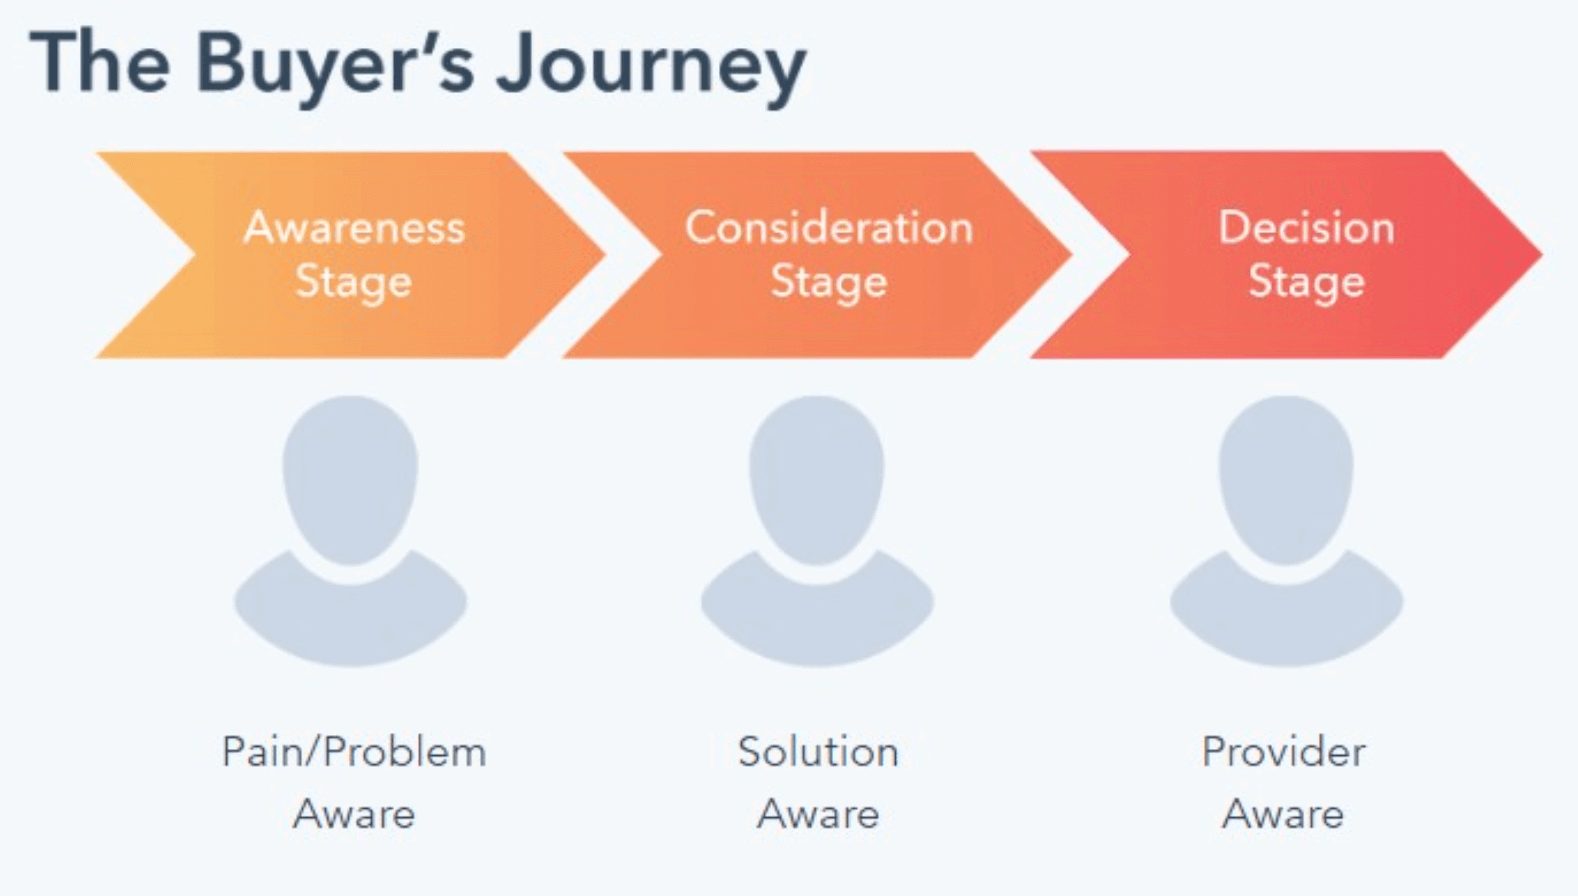
A sales funnel describes the steps that prospects go through to become a customer. These stages are:
- Awareness: A prospect becomes aware they have a problem. This is also when they may come across your product.
- Consideration: A prospect defines their problem and is considering different solutions including yours.
- Decision: A prospect makes a decision and chooses a provider. This is when the final conversion happens.
Why Should You Track Conversion Rates by Funnel Stage?
Not every visit will lead to a conversion. Prospects will naturally drop out of the sales funnel as they move from one stage to the next.
Tracking conversion rates by funnel stage is key to driving sales performance, as it helps you identify weak points in your sales funnel. With these insights, you can optimize your sales process and focus on those activities that generate a high return.
How to Calculate Conversion Rates by Funnel Stage
Here’s how each stage of the sales funnel ties to a typical SaaS company’s sales process:
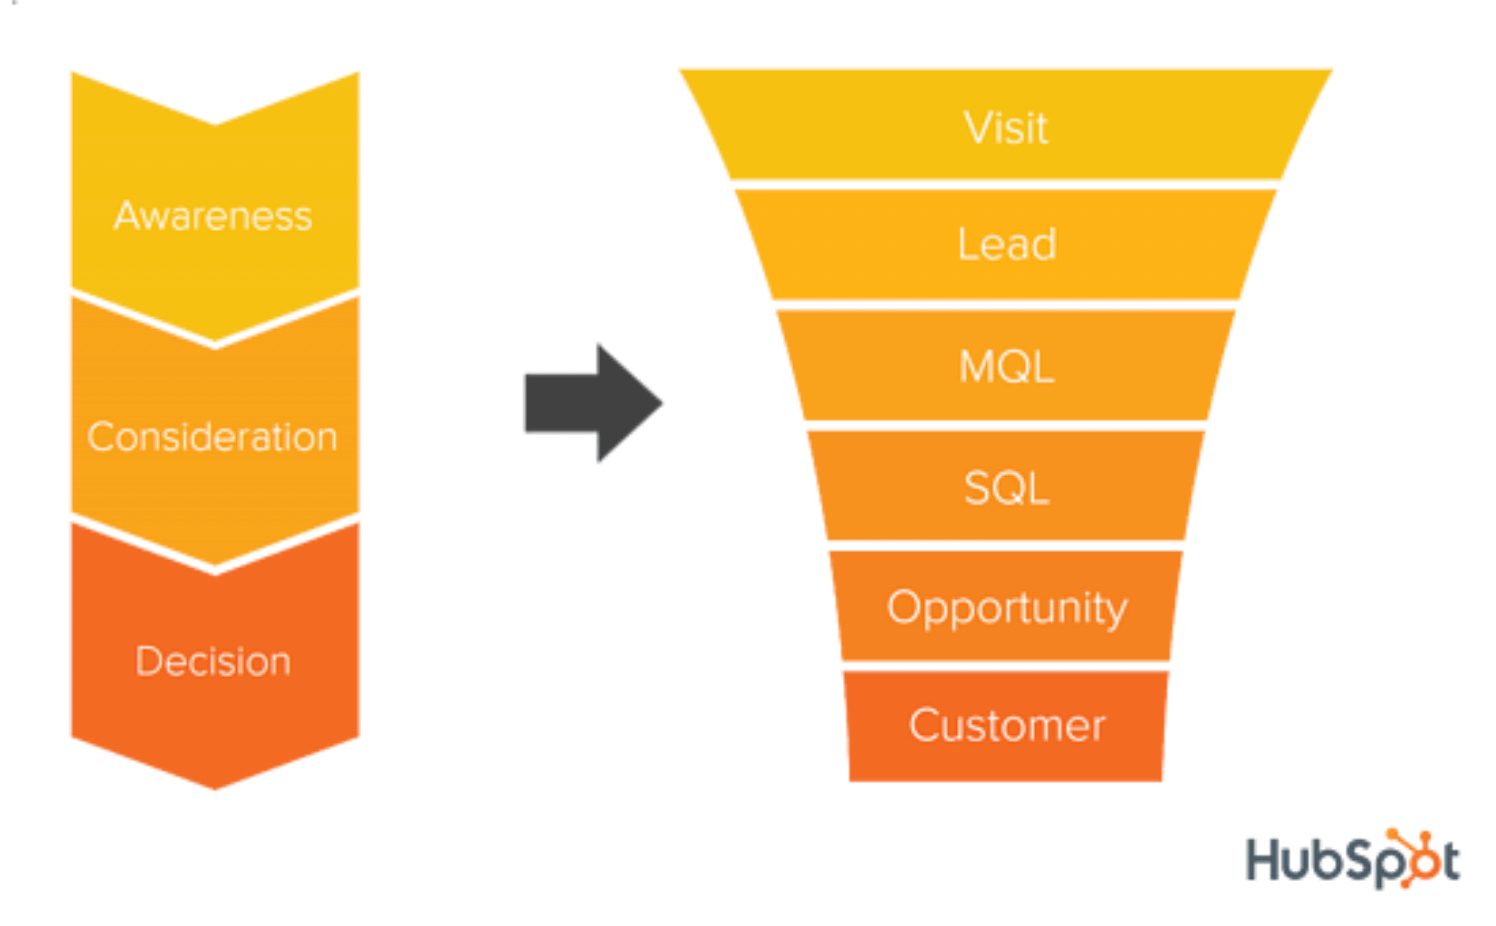
Here are the metrics you’ll want to measure for each stage and how to calculate them:
- Visitor-to-lead conversion rate: (Captured leads / Number of visitors ) x 100
- Lead-to-MQL conversion rate: (Marketing-qualified leads / Number of leads) x 100
- MQL-to-SQL conversion rate: (Sales-qualified leads / Marketing-qualified leads) x 100
- Opportunity-to-customer conversion rate: (Qualified leads / Customers) x 100
If conversion rates are low for any stage, evaluate why prospects are dropping out and take steps to fill in the gaps — refine your buyer personas, adjust your lead scoring strategy, optimize your onboarding process, etc.
What Tools Can Be Used to Calculate and Track Conversion Rates by Funnel Stage?
You can track conversion rates by funnel using software like HubSpot, Salesforce, and Pipedrive. These tools allow you to capture new leads and track them across the sales funnel.
Tips for Tracking and Driving Growth with this KPI
- Segment conversion rates for each funnel stage by source
- Measure conversion rates against industry benchmarks
- Refine your buyer personas to get better marketing results
12. Lead Velocity Rate
Lead velocity rate tracks the growth in the number of qualified leads that you have month over month. A positive lead velocity rate means you’ve gained leads from the previous month.
Why Should You Track Lead Velocity Rate?
Lead velocity rate is one of the most important sales KPIs to track, as it can help you assess the efficiency of your sales process. It can also help you forecast future sales when you combine it with other metrics like conversion rates.
A positive lead velocity rate is a strong indicator of overall business growth (so long as those leads are converting, which is why tracking “lead to close rate” alongside this KPI is so key).
If this metric starts to drop, consider expanding your marketing efforts to capture more qualified leads.
How to Calculate Lead Velocity Rate
Subtract the number of qualified leads you captured last month from the number of qualified leads this month and divide by the number of qualified leads last month. Then multiply by 100 to get a percentage.
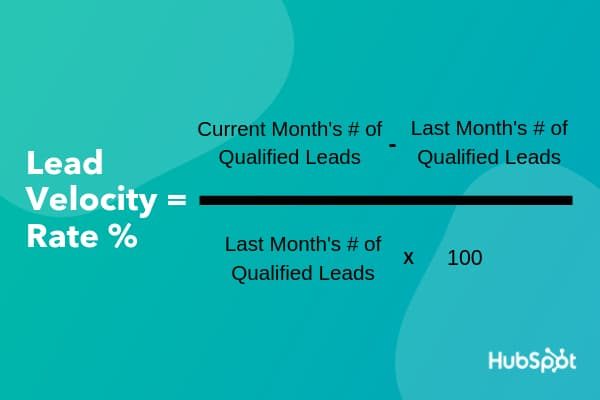
For example, if you have 50 qualified leads this month and 40 leads the previous month, your lead velocity rate would be 25%.
What Tools Can Be Used to Calculate and Track Lead Velocity Rate?
You can calculate and plot lead velocity rates using tools like Excel or Google Sheets, as well as most CRMs.
Tips for Tracking and Driving Growth with this KPI
- Include only qualified leads in your calculations, as non-qualified leads will muddy the waters. Your numbers may look good, without actually being good.
- Track lead velocity rates alongside lead to close rate (see below) to get a complete understanding of your performance.
- Set new lead generation goals each month based on the previous month’s lead velocity rate.
13. Lead to Close Rate
Lead to close rate is the percentage of leads that convert. It compares the number of deals you’ve closed to the leads you’ve captured.
Why Should You Track Lead to Close Rate?
Tracking lead to close rates provides insights into how well your sales team is turning leads into customers. It also helps sales managers measure performance for individual reps.
Once you establish a baseline, you’ll know how many leads you need to generate to reach your sales targets and grow your company.
How to Calculate Lead to Close Rate
Divide the number of conversions you have in a given time period by the number of leads you had. Then multiply by 100 to get a percentage.
For example, if you have 500 leads and 40 of them become customers, your lead to close rate would be 8%.
Lead to close rates vary greatly by industry. A 10% conversion rate may be high for one industry but may be considered low for another.
Determine your lead to close rates and compare them against industry benchmarks to see how well your company is performing.
What Tools Can Be Used to Calculate and Track Lead to Close Rate?
You can use lead management software like Salesforce, HubSpot, and Freshsales to manage your leads and track close rates. Some tools also let you track lead to close rates for each sales rep on a weekly or monthly basis.
Tips for Tracking and Driving Growth with this KPI
- Track lead to close rates for individual sales reps to assess individual performance.
- Constantly update and refresh your sales scripts to reflect consumer behavior, product releases, and what’s working for individual reps.
- Measure close rates by lead source to evaluate your marketing efforts.
- Implement retargeting and lead nurturing campaigns to support your sales team in pushing leads towards conversion.
14. Sales Cycle Length
Sales cycle length is how long it takes on average to close a deal. It’s typically measured in days or months.
Why Should You Track Sales Cycle Length?
Tracking sales cycle length can inform your business strategy and help with sales forecasting based on the number of leads in your pipeline.
This metric is also helpful for measuring sales efficiency. Deals that take longer than average to close could indicate weak points in your sales funnel.
How to Calculate Sales Cycle Length
Divide the number of days it takes on average to close a deal by the total number of deals.
For example, let’s say that your company closed the following deals:
- Deal 1 took 50 days
- Deal 2 took 70 days
- Deal 3 took 65 days
- Deal 4 took 80 days
- Deal 5 took 40 days
Based on these figures, your sales cycle length would be 61 days (305 / 5). With this metric, you can estimate that similar deals will take about two months to close.
The average sales cycle length for SaaS companies is 84 days. If your sales cycle length is longer than average, evaluate and optimize your sales process.
However, a shorter sales cycle length isn’t necessarily a good thing. If deals that close in record time have a higher churn rate, you may need to spend more time nurturing leads to increase retention.
What Tools Can Be Used to Calculate and Track Sales Cycle Length?
You can use a CRM like Salesforce or HubSpot to capture leads and track how long each takes to close.
Tips for Tracking and Driving Growth with this KPI
- Compare your sales cycle length against industry benchmarks
- Segment your sales cycle length by lead source
- Optimize your sales funnel to shorten your sales cycle
Finance KPIs for SaaS Companies
Finance KPIs measure your SaaS company’s financial performance by tracking its revenue, expenses, profits, sales, and any other financial outcomes.
Let’s get into the KPIs most relevant to your finance team.
15. Quick Ratio
The Quick Ratio, also known as an acid test ratio, measures a business’ ability to pay off its short-term liabilities with assets that can be quickly converted into cash. These assets include cash, marketable securities, and any other assets that can be turned into cash in 90 days or less.
Why Should you Track Quick Ratio?
The Quick Ratio is a good indicator of your business’ short-term fiscal health and its ability to survive situations that cause temporary cash-flow problems. Tracking changes in your Quick Ratio over time can help you uncover potential problems and fix them before they escalate.
This metric also tells lenders and investors whether your company is financially stable enough to lend money.
How to Calculate Quick Ratio?
To calculate your Quick Ratio, simply divide your current assets (minus your inventory) by your current liabilities. Inventory is excluded from this calculation because it’s not as “liquid” as your other assets.
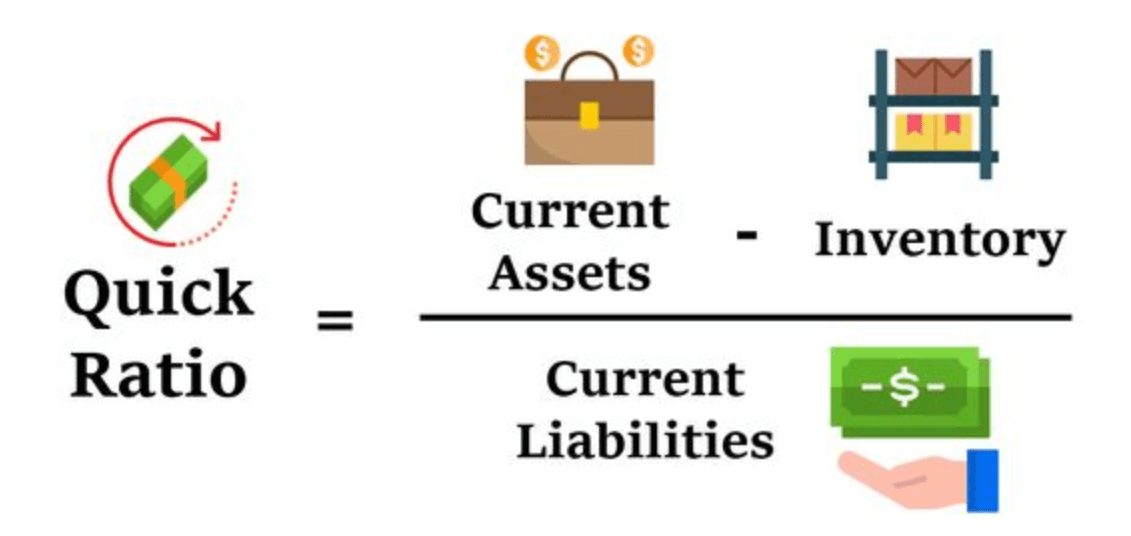
For example, say your current assets for this month are $12,000 and $2,000 of this is from inventory. Let’s also assume your liabilities for this month are $5,000. Given this information, your Quick Ratio will be:
Quick Ratio = ($12,000-2,000)/5,000= $10,000/$5,000 = 2.00
A Quick Ratio of 2 means that you have twice as many quick assets as current liabilities, which is indicative of strong financial health.
What Tools can be Used to Calculate and Track Quick Ratio?
Your balance sheet has all the information you need to find out your Quick Ratio. If you need help calculating it, consider using tools like online templates or accounting software.
Tips for Tracking and Driving Growth with this KPI
- Use the Quick Ratio in conjunction with other financial metrics like the current ratio or cash ratio to get a more complete picture of your company’s liquidity.
What is a Good Quick Ratio?
A Quick Ratio equal to or greater than 1.00 indicates that your organization is safe, meaning it has enough quick assets to pay its short-term financial obligations. A business with a Quick Ratio below 1.00 may struggle to pay off its debts and have to sell off some long-term assets to meet its financial obligations.
16. Customer Acquisition Cost (CAC)
Customer Acquisition Cost (CAC) measures how much money you need to spend to acquire a new customer.
Why Should you Track Customer Acquisition Cost?
CAC is a key metric in SaaS. By comparing how much money you spend on attracting customers against the revenue earned from that customer in their lifetime, you’re able to determine your company’s profitability and efficiency.
Knowing your CAC also helps you determine your marketing spend and drives other strategic business decisions.
How to Calculate Customer Acquisition Cost
CAC is calculated by adding up the total marketing and sales expenses for a certain period and dividing it by the number of new customers acquired during that period. These expenses are any costs you incur to attract and convert a new customer. This includes anything from PPC campaigns to the salaries of the marketing and sales team.
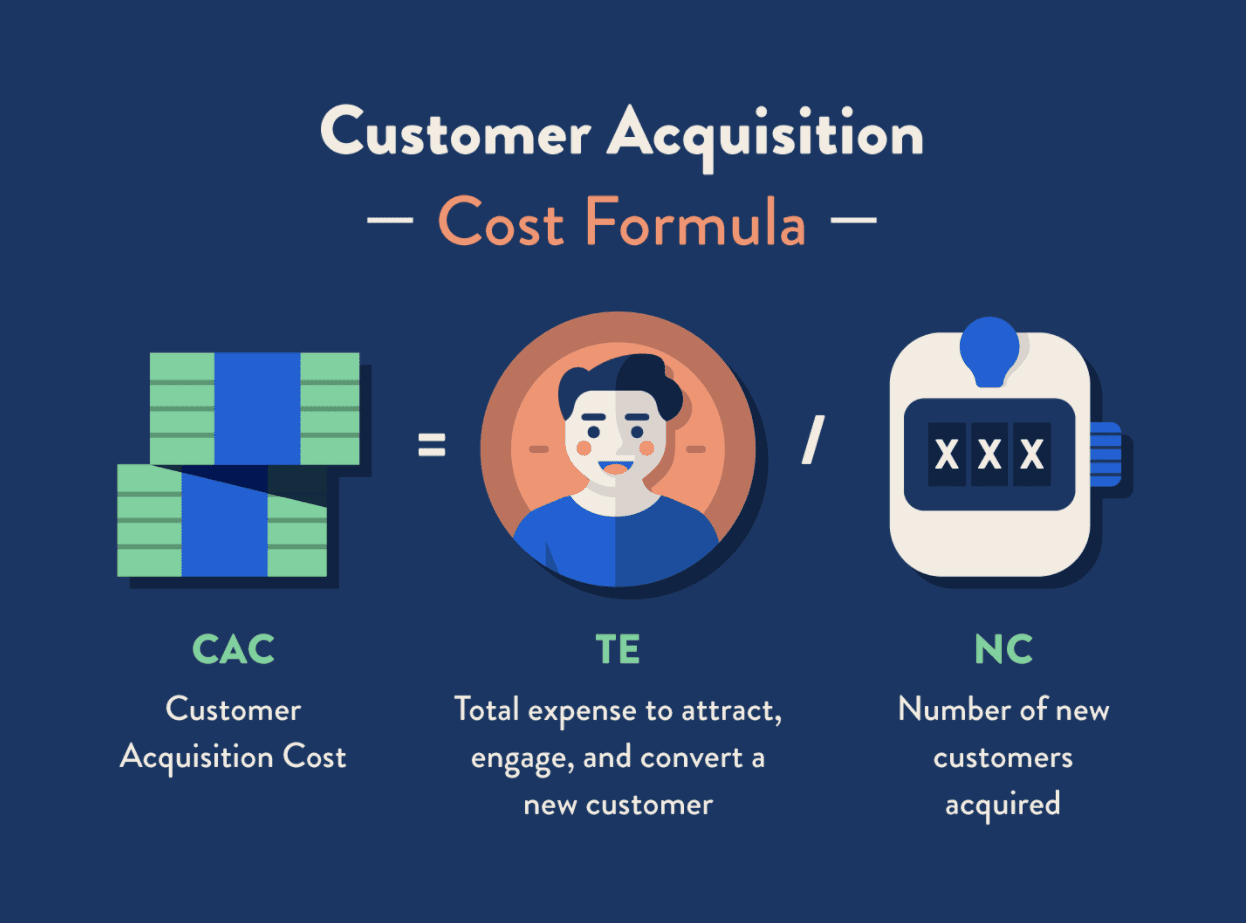
Suppose your sales and marketing spend to acquire new customers this quarter was $30,000. Additionally, you gained 200 new customers during this quarter. As a result, your CAC is:
CAC = $30,000/300 = $150
Your company spends $150 to acquire new customers.
Tips for Tracking and Driving Growth with this KPI
To gain more insights from your CAC, it’s useful to break it down and segment it. CAC is commonly divided into Blended and Paid:
- Blended CAC accounts for all types of marketing channels
- Paid CAC only accounts for paid channels.
Segregating these costs helps you figure out whether your paid channels are profitable.
CAC by itself gives you an incomplete picture. CAC should be analyzed alongside the Customer Lifetime Value (CLV), a metric we’ll look at shortly. Your CAC should never be higher than your LTV.
17. CAC Payback Period
This SaaS KPI measures how much time it takes to earn back the money invested in acquiring new customers. Here’s how it works:
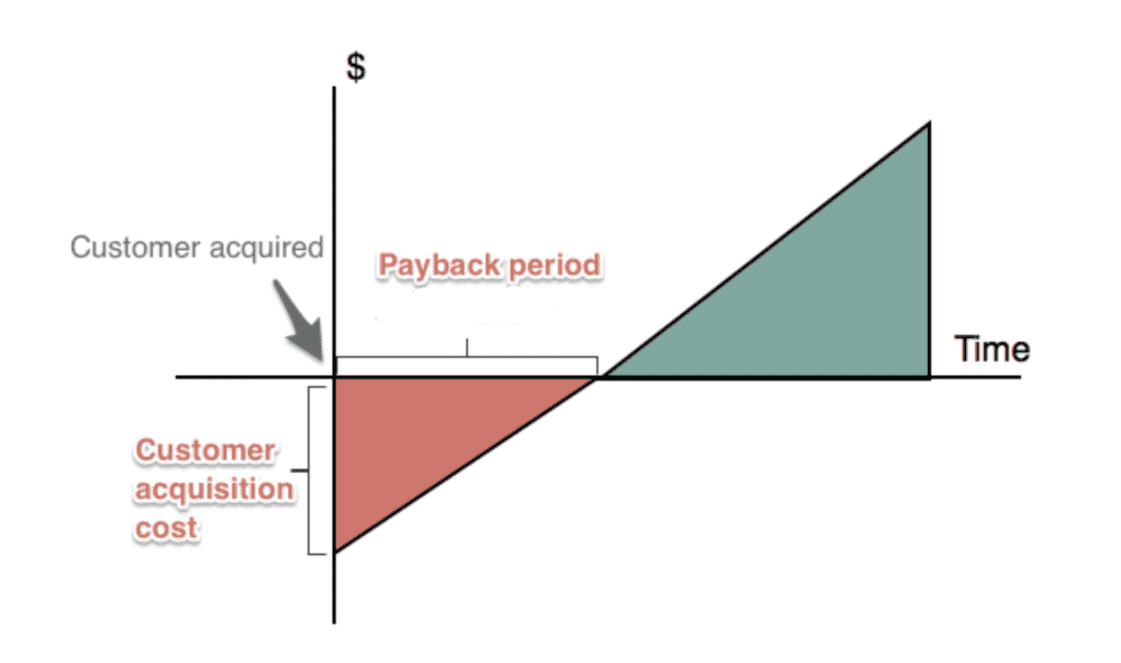
Over time, the customer’s subscription payments gradually pay back the initial cost until you break even. The green area is the period where the customer’s payments start contributing to the company’s growth.
Why Should you Track CAC Payback Period?
The CAC Payback Period reveals how efficient and sustainable your business’ acquisition model is. The shorter the payback period, the faster your company can recover acquisition costs and grow.
How to Calculate CAC Payback Period
To calculate your CAC Payback Period, you’ll need to know three other key metrics:
- Customer Acquisition Cost (CAC)
- Average Revenue Per Account (ARPA)
- Gross Margin percent
The ARPA and Gross Margin give you the revenue generated from a customer over a period of time. Your payback period is then calculated as follows:

For example, let’s assume it costs you $150 to gain a new customer. This customer’s monthly subscription generates $15/month. Your CAC Payback Period is:
CAC Payback Period = $150/15 = 10 months
It will take 10 months to recover the money invested to acquire them.
The industry benchmark for SaaS startups to recover CAC is 12 months or less. The shorter your payback period, the better. High-performing SaaS companies break even in 5-6 months.
Aim to keep this metric low and focus on ways to reduce it.
What Tools Can be Used to Calculate and Track CAC Payback Period?
Our plug-n-play excel template for SaaS financial model is free, easy to use, and helps you track your CAC Payback Period. Click here for a complete walkthrough of the template.
Tips for Tracking and Driving Growth with this KPI
Similar to CAC, you can segment your CAC Payback Period to gain more actionable insights from it.
By comparing the payback period of customers acquired through different marketing channels, you can use this information to invest in your most profitable channels.
18. Customer Lifetime Value (CLV)
Customer Lifetime Value (CLV) lets you know much revenue you can generate from a customer throughout your relationship with them before they leave (churn).
Why Should you Track Customer Lifetime Value (CLV)
CLV is a key metric because it guides your company’s critical marketing and sales strategies, such as customer acquisition and retention, cross-selling, upselling, and support. For example, it helps you decide how much to spend on acquiring new customers.
How to Calculate Customer Lifetime Value (CLV)
The formula used for calculating CLV is:
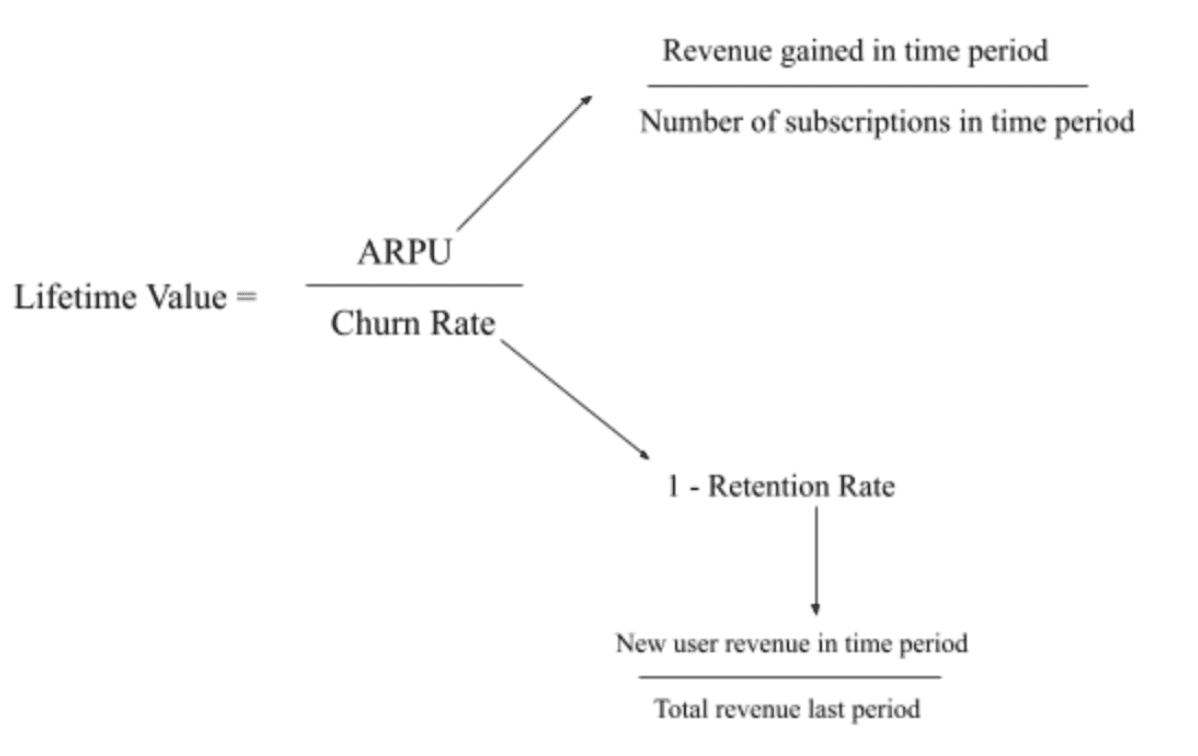
Alternatively, you can also calculate CLV using the formula LTV = ARPU * Gross Margin * Average duration of customer contracts.
Let’s look at a quick example using the churn rate:
Assume your average user pays $50/month for a subscription. This month, you lost 5 customers out of 100 so your churn rate is 5%. Given this information, the CLV is:
CLV = $50/ 0.05 = $1,000
What Tools Can be Used to Calculate and Track Customer Lifetime Value (CLV)?
You can calculate and keep track of your CLV using Chargebee’s ready-to-use excel template, which you can download and customize for your business.
Tips for Tracking and Driving Growth with this KPI
- Use CLV insights to acquire and hold on to high-value customers, and move low-tier customers to a higher-tier plan or subscription.
- Tracking CLV helps you predict future demand and inventory.
How to Interpret Customer Lifetime Value (CLV)
CLV should be looked at in relation to your CAC, as you’ll see in the next metric. According to David Skok, to ensure your SaaS business is profitable, your CLV should be 3x your CAC.
19. CAC:LTV Ratio
The CAC: LTV ratio (“Customer Acquisition Cost: Lifetime Value) measures the relationship between the value a customer brings to your business and the cost of acquiring them.
Why Should you Track CAC:LTV Ratio?
CAC:LTV is one of the most important financial SaaS metrics for several reasons:
- It helps you determine how much money you should be spending on acquiring customers and what types of customers to acquire.
- It’s a critical metric investors look at
- It helps you measure your return on sales and marketing efforts and reveals how sustainable your business model is
How to Calculate CAC:LTV Ratio
As the name suggests, the ratio is found by dividing the lifetime value by the customer acquisition cost.
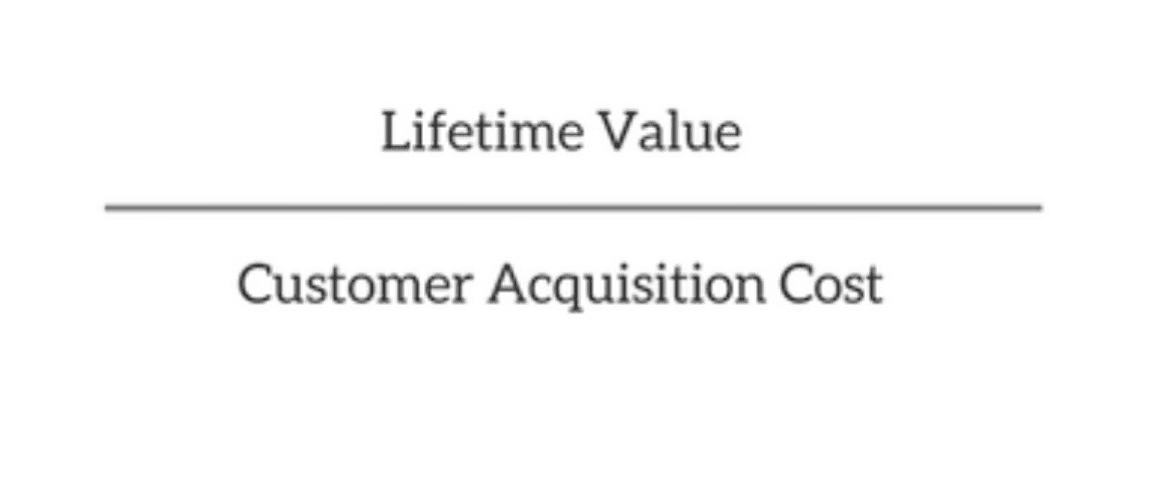
A company with a customer lifetime value of $500 that spends $100 to acquire new customers will have the following CAC:LTV ratio:
CAC:LTV Ratio = 500/100 = 5:1
A (very good) ratio of 5:1 tells us this company makes 5x of what it would spend on acquiring customers.
Tips for Tracking and Driving Growth with this KPI
The CAC:LTV Ratio indicates how valuable your company is. Optimize your ratio by:
- Focusing on the right channels to attract customers
- Experimenting with pricing
- Reducing your sales complexity
What Is A Good CAC:LTV Ratio?
As we already touched on, a good rule of thumb for the CAC:LTV Ratio is 3:1. A high ratio means you’re keeping your customers happy for an extended time and you’re not spending much acquiring them. If your ratio is low, look for ways to reduce your CAC or increase your LTV.
Revenue KPIs for SaaS Companies
To establish steady growth and track your company’s financial health, you’ll want to keep a finger on your revenue KPIs pulse. Revenue KPIs are big-picture metrics that tell you how well your company is doing by tracking changes in revenue over time.
Let’s jump into the key revenue KPIs.
20. Average Revenue Per Account (ARPA)
When you’re operating on a subscription business model, average revenue per account (ARPA), measures the average revenue you generate from your customer accounts over a period of time.
Why Should you Track Average Revenue Per Account?
This valuable metric helps you measure revenue growth and track your business’ financial health. If your ARPA is consistently increasing, it indicates that your sales and marketing efforts are attracting the right customers.
It also provides insight into what’s working and what’s not, so you can identify growth opportunities. For instance, if you have different subscription tiers, ARPA will tell you which pricing plans bring in the most revenue and which are under-performing.
How to Calculate Average Revenue Per Account
ARPA is calculated by taking your total recurring revenue for a specific period and dividing it by the total number of accounts (or paid subscriptions) in that period. It looks like this:
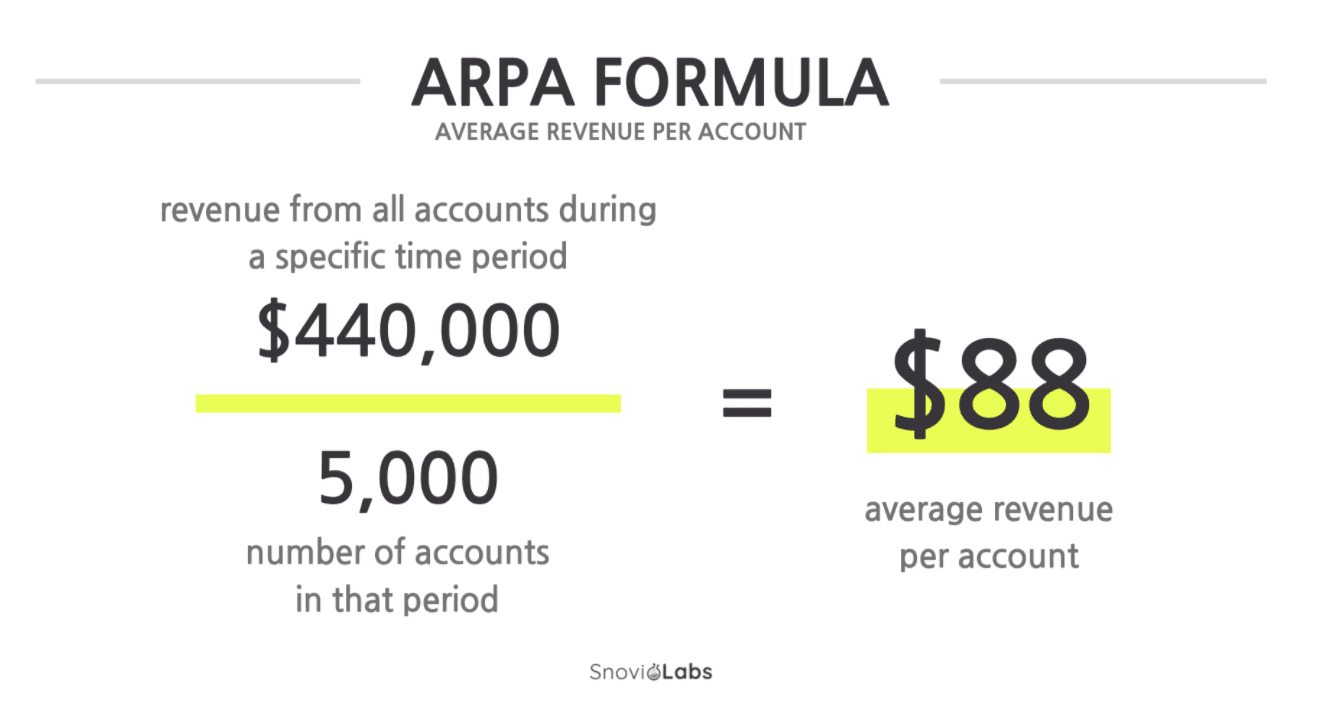
This calculation is usually done on a monthly, yearly, or even quarterly basis, depending on your business model. For example, if you bill your customers monthly, you would simply divide your monthly recurring revenue (MRR) by the total number of accounts.
What Tools Can be Used to Calculate and Track Average Revenue Per Account?
The easiest way to track ARPA and many other revenue metrics is to use a SaaS dashboard. For instance, Chargebee’s insight-driven reporting dashboard gives you full visibility and lets you analyze key revenue metrics like ARPA so you can make effective decisions for your business.
Tips for Tracking and Driving Growth with this KPI
Correctly interpreting ARPA is important, otherwise, it can give you an inaccurate picture of your performance.
This can happen if your subscription tiers have a wide pricing range. If only a few of your customers pay significantly more than the rest, it can make your ARPA look much higher than it actually is.
You can avoid this by tracking your new and existing customers and calculating other related SaaS metrics like the MRR growth rate alongside your ARPA.
How to Interpret Average Revenue Per Account
Compare your ARPA to the industry average to get a better idea of how your business is performing against its competitors.
21. Monthly Recurring Revenue (MRR)
Monthly recurring revenue (MRR) calculates all the predictable and recurring revenue generated by your customers each month, like subscription fees. This means that one-time fees, free trials, or any variable fees are not included in your calculations.
Why Should you Track Monthly Recurring Revenue?
Tracking your MRR helps you easily determine the financial health of your business. An expanding MRR indicates your business is growing, while a declining MRR means your business is shrinking.
Since MRR tracks predictable revenue, it also helps you make more accurate sales projections and plan for future growth.
How to Calculate Monthly Recurring Revenue
To calculate your MRR, take the average monthly revenue from each customer and multiply it by the total number of paying customers.

For example, let’s assume you have 6 customers. Four of them are paying $50/month and the other two are paying $25/month. Your MRR will be:
MRR: (4 x $50) + (2 x $25) = $200 + $50 = $250
If all your customers are paying the same monthly fee, then your calculation will be even more simple. For example, if you have 10 customers all paying $50/month, your MRR will be 10 x $50 = $500.
What Tools Can be Used to Calculate and Track Monthly Recurring Revenue?
Software like Chargebee’s RevenueStory allows you to easily track and calculate MRR and various MRR components.
Here’s a snapshot of what’s visible and how we break it down:
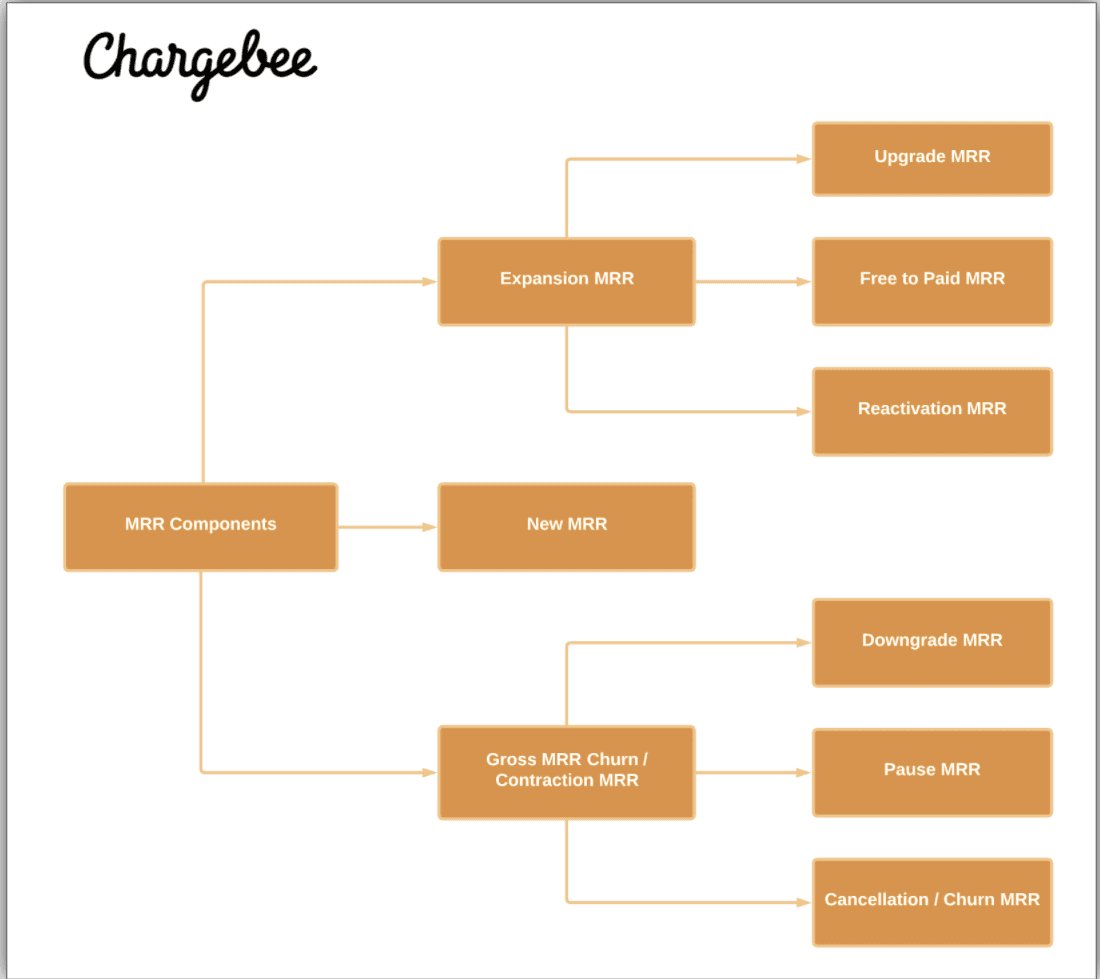
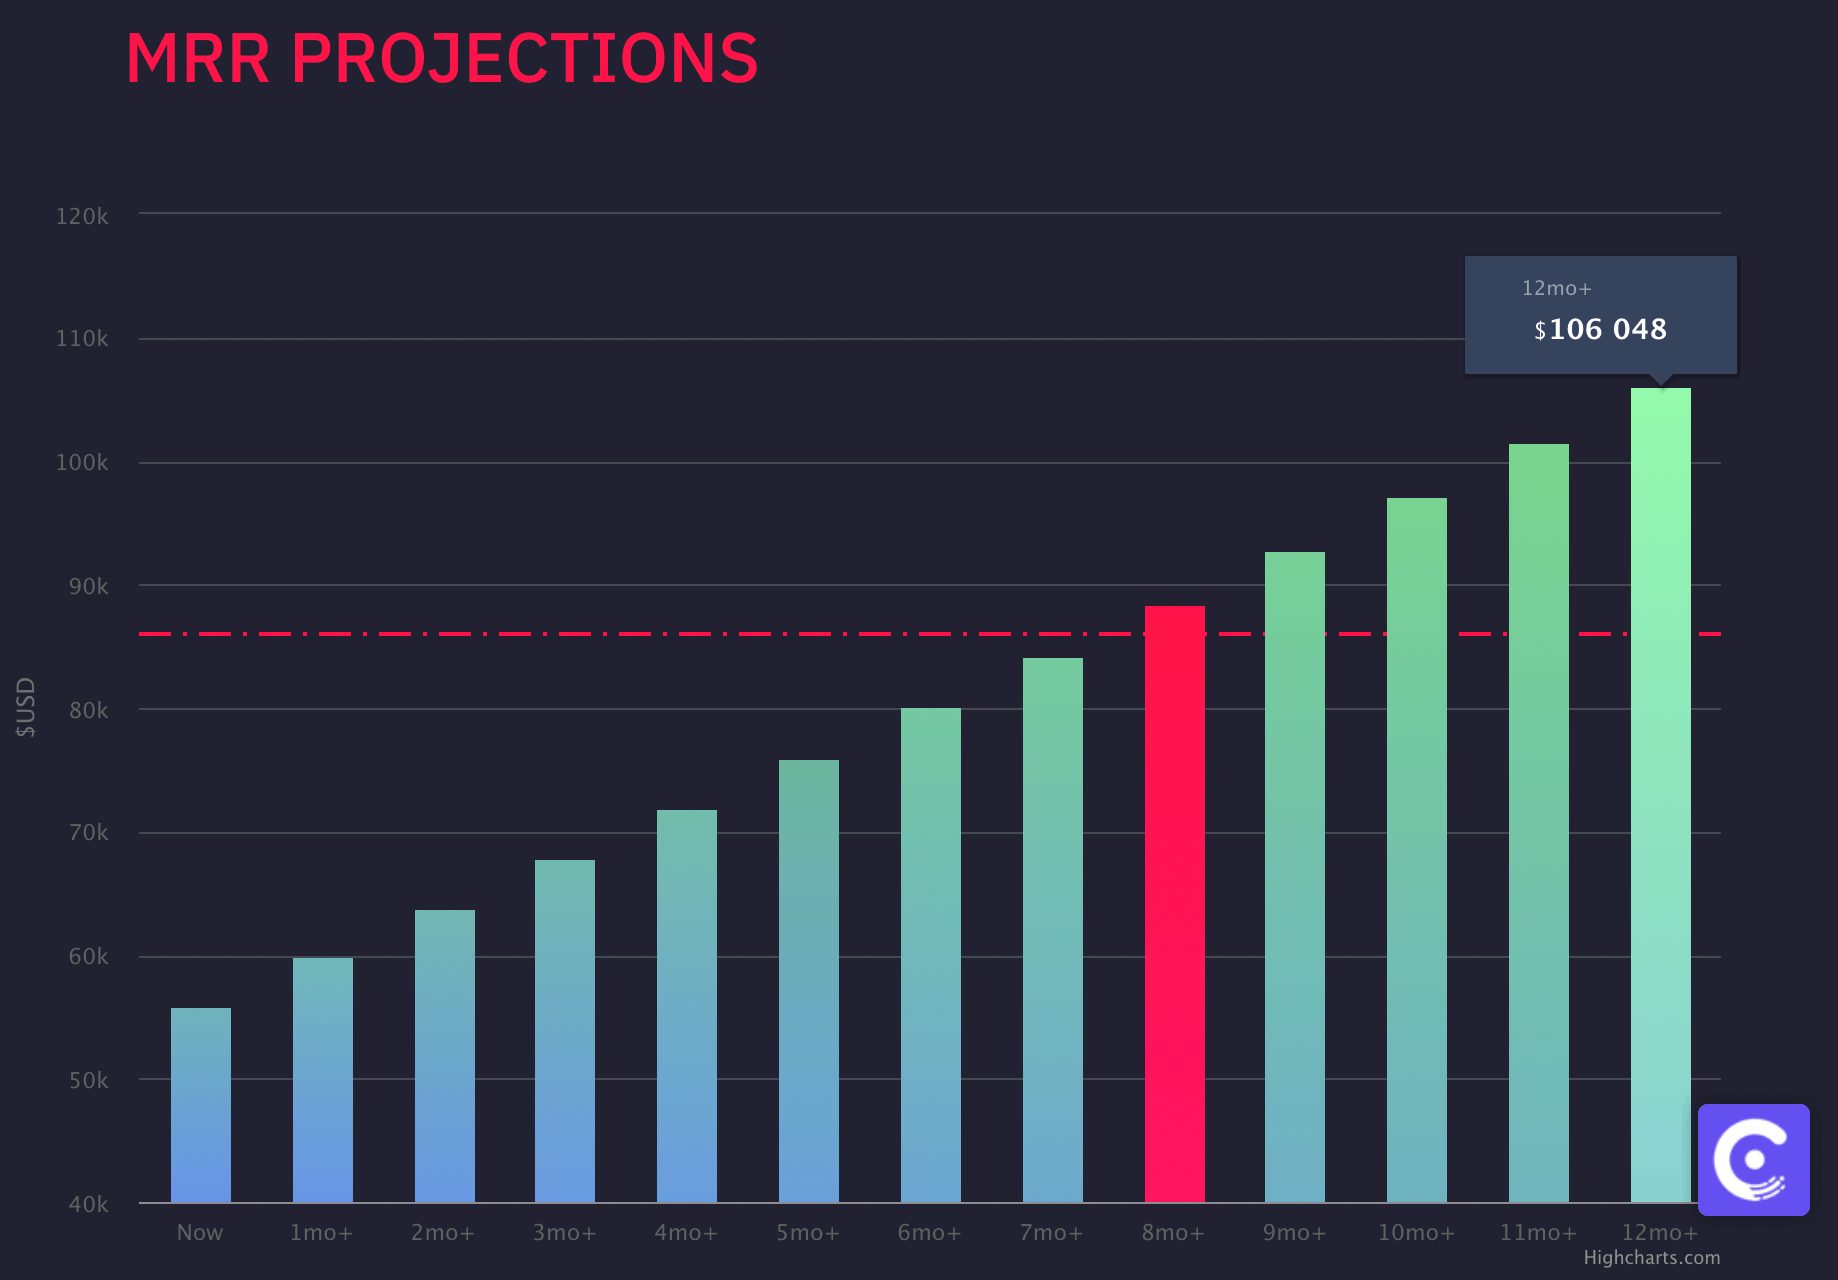
Chargebee’s MRR Projection Tool also helps you predict when you will reach your MRR goal.
Tips for Tracking and Driving Growth with this KPI
Your MRR helps you determine if your revenue is declining or growing over time. To accurately measure your business’ performance, your MRR can be broken down into subcategories: New MRR and Churn MRR.
New MRR measures how much revenue your new customers each bring in each month, while churn MRR measures how much you’ve lost from subscription cancellations.
How to Interpret Monthly Recurring Revenue
If your churn MRR exceeds your new MRR, you’re losing more customers than you’re gaining, which can spell trouble for your business.
22. Annual Recurring Revenue (ARR)
Annual Recurring Revenue, or ARR, is a key metric that measures how much money you can expect to generate from your subscribers annually. To calculate ARR, your business must offer subscription contracts for at least a year or longer. You can also think of ARR as the annual version of MRR.
Why Should you Track Annual Recurring Revenue?
ARR is a valuable metric for a subscription-based business for multiple reasons:
- Communicates the health of your business to investors
- It’s an indicator of future growth
- Tracks revenue gained from new sales and upgrades
- Tracks lost revenue from customer churn and downgrades
How to Calculate Annual Recurring Revenue
Similar to MRR, ARR calculations exclude any one-time fees or set-up fees and only take into account recurring revenue.
Calculating ARR is simple. If you bill customers annually, the formula to calculate ARR is:

For example, if a subscriber signs a 3-year contract at $30,000, your ARR will be:
ARR = $30,000/3= $10,000
If you bill your customers monthly, the ARR is calculated as follows:

Say your customer signs a 2-year (24-month) contract for $20,000. In this case, your ARR will be:
ARR= $20,000 X 12/24 = $10,000
What Tools Can be Used to Calculate and Track Annual Recurring Revenue?
For the most accurate tracking and reporting of metrics like ARR, use subscription management software like Chargebee. Chargebee lets you go deeper into MRR growth across plans, and analyse retention cohorts month-on-month. Completely customise dashboards, build your own reports without any code or Excel sheets, and drive alignment across the organization. Chargebee’s reporting capability lets you analyse your revenue from multiple perspectives: product, sales, marketing, finance, retention, and more!
Tips for Tracking and Driving Growth ARR
Here are some tips on how to use ARR to your business’ advantage:
- Use ARR insights for long-term planning and future decision-making.
- ARR is a forward-looking metric — it should be used to determine how much revenue you can expect in the future, not how much you’ve generated in the past year.
- To get an accurate ARR, it’s important to account for any discounts or coupons given to customers when calculating it.
How to Interpret Monthly Recurring Revenue
ARR gives you an overview of how well your business is performing. By tracking your growth year after year and focusing on internal benchmarks, you can see if your current strategy is resulting in progress. If not, it’s an opportunity to re-evaluate your business decisions and change your trajectory.
23. Net Burn Rate
When you’re a budding startup, monitoring your burn rate is imperative to your future growth and success.
At the beginning of your startup’s life cycle, you’ll burn through cash to reach profitability. For a while, you’ll spend more than you earn, which is normal for a startup in its early stages.
The net burn rate shows the rate at which a business is losing or “burning through” money so it can continue operating.
Why Should you Track Net Burn Rate?
Understanding how fast cash reserves are decreasing is important for both startups and mature businesses.
The net burn rate tells you how long your startup’s cash balance can cover your losses before you run out of money. This is your cash runway. Having this crucial information allows you to maintain a sustainable burn rate so you don’t deplete your cash reserves and go broke.
At the same time, mature businesses use the net burn rate as a metric to measure performance.
How to Calculate Net Burn Rate
The net burn rate is calculated by subtracting operating expenses from the revenue. In other words, it measures the difference between cash in and cash out, as follows:

As it’s typically calculated monthly, let’s look at a quick example. If your income for this month is $150k and you’re spending $250k, your monthly net burn rate is:
Net Burn Rate = $250 – $200 = $50k
What Tools Can be Used to Calculate and Track Net Burn Rate?
The best way to monitor your net burn rate is to take advantage of user-friendly online software that has a built-in calculator.
What is a good burn rate?
Ideally, you’ll want to keep your net burn rate relatively low to ensure you’re prepared for any uncertainties. According to experts, startups should have 12-18 months’ worth of runway.
However, a temporarily high net burn rate is not necessarily a bad thing, as long as your business is consistently growing.
If your burn rate is consistently high, that’s an indication you’re bleeding money and need to curb your spending or extend your cash runway.
If you manage your burn rate wisely, you can make your business profitable and take it to the next level.
24. Revenue Churn
Another essential SaaS metric, revenue churn, measures how much recurring revenue SaaS businesses lose over time due to downgraded or canceled subscriptions.
Why Should you Track Revenue Churn?
Revenue churn is a key performance metric because it tells you how good you are at retaining revenue. The lower the revenue churn, the better. Regularly monitoring this metric allows you to take appropriate action and find ways to reduce churn.
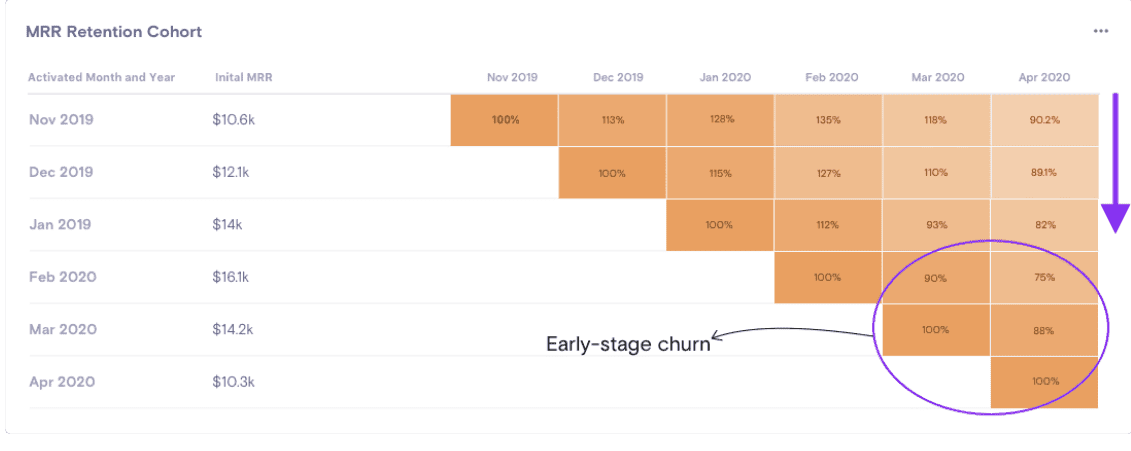
Revenue churn allows businesses to observe customer behavior, leading to actionable insights. For example, you can group all customers who canceled their subscriptions in a particular month into one cohort, using tools like the MRR Retention Cohort from Chargebee’s RevenueStory. This chart offers valuable insights, like the fact that customers acquired in recent months have churned more than older customers.
How to Calculate Revenue Churn
To find out your revenue churn, you’ll need to know the revenue lost through cancellations in a given period (churned MRR) and the revenue available at the start of that period.

For example, if you have $200,000 MRR at the beginning of this month and lose $10,000 from customer cancellations and downgrades, your revenue churn for the month will be:
Revenue churn = 10,000/200,000 = 5%
What Tools Can be Used to Calculate and Track Revenue Churn?
Chargebee’s RevenueStory helps you track and calculate revenue churn, while the Churn Management Suite helps you prevent revenue churn.
What is a good revenue churn rate?
According to a 2019 SaaS report by KeyBanc Capital Markets, the median annual revenue churn benchmark was 13.2%. However, an acceptable churn rate can vary from one company to the next and depends on factors like your industry, economy, the type of customers you serve, and pricing plans.
Ideally, a company should strive to get to the 5-7% range and consistently push to reduce churn.
How to Interpret Revenue Churn
A low revenue churn indicates you’re good at retaining customers while a high revenue churn is a signal that your business is in poor health. It may be time to pause, reevaluate your product, target users, competitors, or onboarding processes.
25. Revenue Growth Rate
Revenue growth rate shows a company’s increase in revenue over a period of time, indicating how quickly it’s growing.
Why Should you Track Revenue Growth Rate?
Tracking revenue growth momentum reveals how profitable a company is and whether its growth is sustainable in the long term. Investors look at this metric to determine whether a startup is worth investing in or not.
How to Calculate Revenue Growth Rate
Revenue growth rate is usually expressed as a percentage. The basic formula to calculate it is:

Let’s look at a simple example: If your total revenue for April is $10,000 and your March revenue is $8,000, then your revenue grew by 25% from March to April.
What Tools Can be Used to Calculate and Track Revenue Growth Rate?
There’s no shortage of revenue tracking software that calculates and keeps track of revenue growth. The right software will not only track, but also provide you with reports full of insights into your revenue.
Tips for Tracking and Driving Growth with this KPI
Benchmarking your revenue growth rate against similar competitors (think similar size, age, funding type, etc.) will tell you if your growth is sustainable.
Growth rate benchmarks depend on different factors like what stage your company is currently at. For example, older companies experience a slower growth rate than startups. That’s why it’s important to measure against organizations that are similar to yours.
According to the Rule of 40, a popular metric in the SaaS industry, a company’s growth rate when combined with its profit margin should exceed 40%.
Customer Success KPIs for SaaS Companies
Your business’ customer success teams are the beating heart of your user and client interactions. But how do you know if they’re doing well?
In this section we’ll review the top customer success KPIs you can review to determine how your team is performing from first touchpoint through to driving loyalty.
26. Number of Support Tickets Created
This metric measures (as you might expect) how many new support tickets are created in a given time period.
Why Should You Track the Number of Support Tickets Created?
You can learn a lot by monitoring the volume of support tickets.
For example, if a product update leads to a spike in support tickets, it’s a sign that the update is creating issues for customers. And if the number of tickets is regularly exceeding your current team’s capacity, you know you need to hire more staff or streamline their process.
How to Calculate the Number of Support Tickets Created
No difficult calculations here — this KPI is simply the total number of new support tickets created within the reporting period, which could be a day, week, month, or year.
What Tools Can Be Used to Calculate and Track the Number of Support Tickets Created?
Any support ticketing system should be able to report on this number.
Tips for Tracking and Driving Growth with this KPI
- Note that, if you don’t have staffing concerns, the actual number is less important than trends and patterns.
- If you have multiple support channels, like email and live chat, track this metric for each channel.
How to Interpret the Number of Support Tickets Created
Use this metric to find out what causes your customers to need more support. Tracking the number for different channels, customer segments, or support categories gives you even more information.
You can reduce the number of tickets — and take a burden off of your team — by creating more self-service support content.
27. Average First Response Time
Average first response time (FRT) is the time that passes between a customer creating a support ticket and your support team responding to it.
Why Should You Track Average First Response Time?
Modern consumers have high expectations for quick responses. If you’re too slow, it has a negative effect on the customer experience.
Using FRT as a KPI can help you work toward a faster response and better service.
How to Calculate Average First Response Time
To calculate average FRT you’ll need to know the first response time for all of your support tickets. Add them together and divide by the total number of tickets to find the average.
What Tools Can Be Used to Calculate Average First Response Time
Your support ticketing solution probably has the ability to track response time.
Tips for Tracking and Driving Growth with this KPI
- Only include the time it takes for a human to respond to a support inquiry. Don’t include automated responses and don’t include follow-ups.
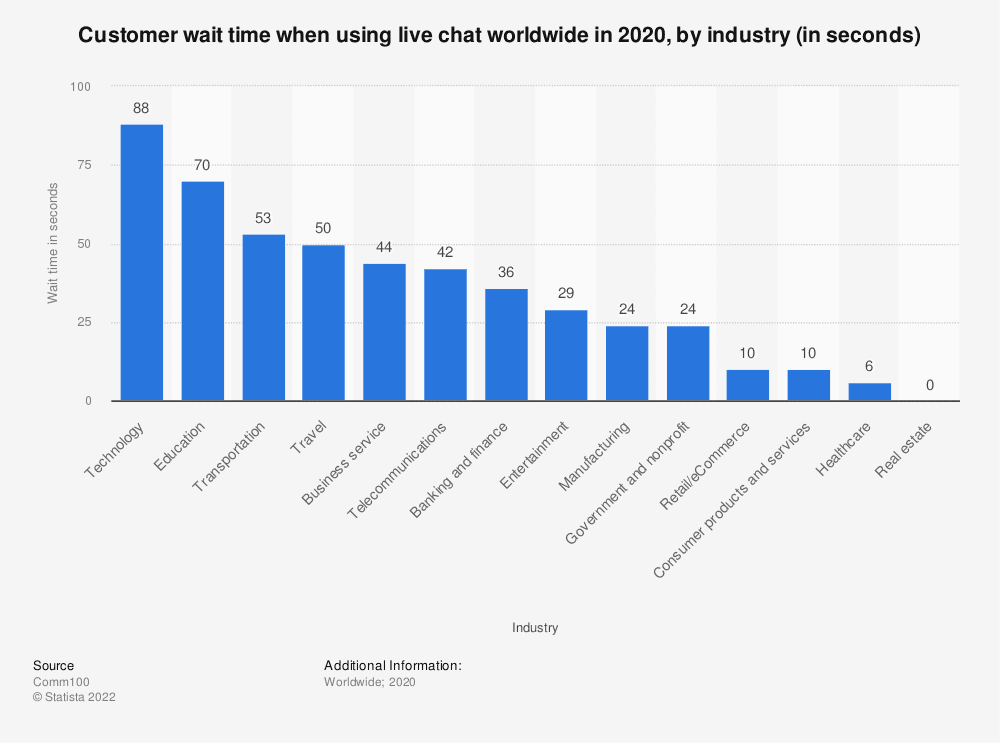
- Expected response times vary a lot by channel, so track them separately. Customers can accept waiting hours for an email, for example, but will be unhappy if live chat isn’t answered in more than a minute or so.
- Check the industry benchmarks below against your team’s performance:
How to Interpret Average First Response Time
Faster is better — except when quality is compromised. One study found that companies with an email response time of 6-12 hours had significantly higher quality answers than those that responded in less than 6 hours.
Strive to be quick, but only if your responses are excellent.
28. Average Resolution Time
Average resolution time (ART), also called average handle time (AHT), measures how much time passes between when a support ticket is created and the ticket is resolved.
Why Should You Track the Number of Support Tickets Created?
Customers appreciate a fast response time, but what they really want is a quick solution to their problem. Tracking ART helps you see how you’re doing on that front.
How to Calculate Average Resolution Time
To calculate your average resolution time, you need to track how much time passes between tickets being opened and being closed.
Add up the resolution time for all of your support tickets and divide that number by the total number of tickets. This is your average resolution time.
What Tools Can Be Used to Calculate and Track Average Resolution Time?
Helpdesk software can be used to track time to resolution.
Tips for Tracking and Driving Growth with this KPI
- Calculate a separate average resolution time for each channel to see where you need to streamline your processes.
- See if your resolution time varies based on time of day or day of the week. While slowdowns are expected at night or on the weekends, you might also find that your support team is overtaxed in the morning (for example) and you would benefit from part-time help.
- If you have international or overseas support queries, consider hiring a virtual assistant to cover those time zones.
How to Interpret Average Resolution Time
As long as you solve the customer’s problem, faster resolution is always better.
If it’s taking you a long time to resolve tickets, there are a few things you can try:
- Hire additional support staff so that team members have more time to work on each ticket
- Reduce the total number of tickets by creating more self-service support content
- Streamline your processes to speed up resolution. For example, automate common support tasks like password resets.
29. Net Promoter Score (NPS)
Net Promoter Score is a measure of customer experience and satisfaction that you find by asking your customers one simple question: “On a scale of 1 to 10, how likely are you to recommend us to a friend or colleague?”
Why Should You Track Net Promoter Score?
NPS doesn’t just measure customer behavior — it lets you know how your customers really feel about you. It offers a way to understand how satisfied and loyal they are.
One of the best things about NPS is that it’s easy for both you and the customer. They only have to answer one question, and it’s simple for you to calculate and interpret the results.
How to Calculate Net Promoter Score
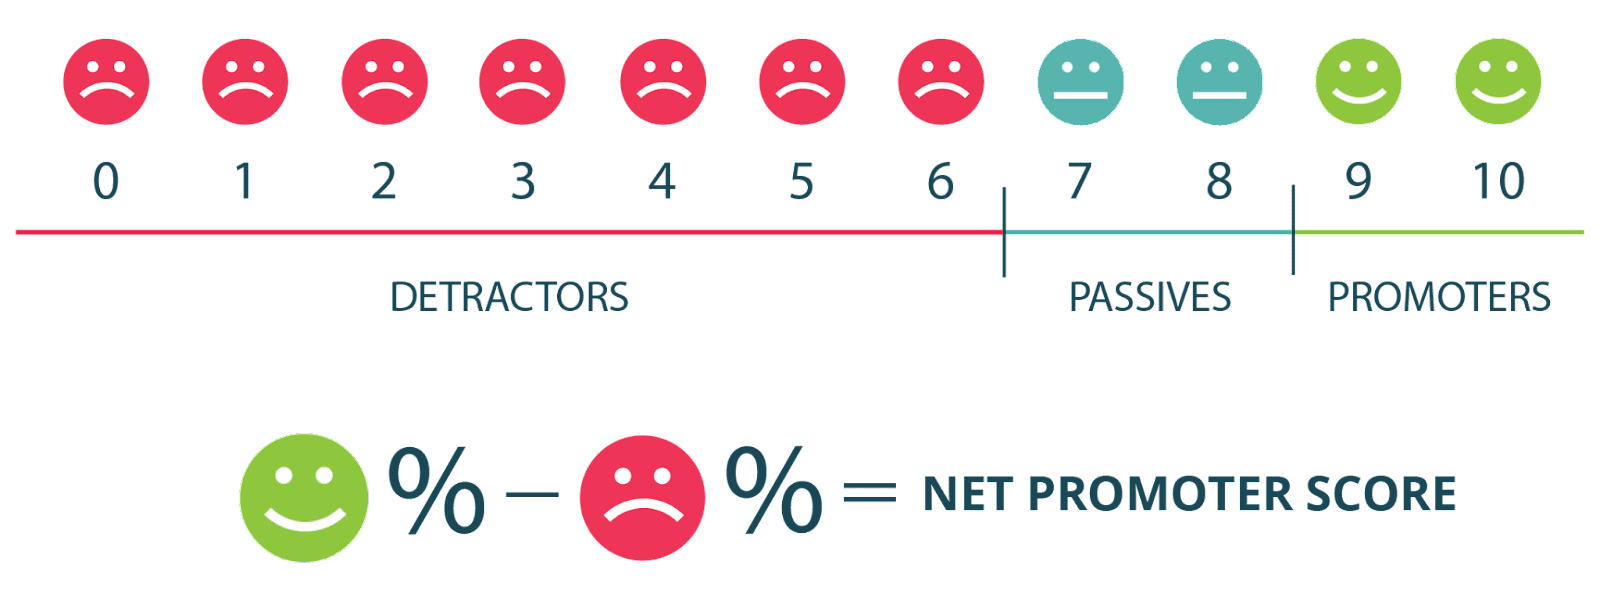
The first step is to categorize respondents by the score they gave you. Those that choose 0-6 are detractors, 7-8 are passives, and 9-10 are promoters.
You can ignore the passives. To find your Net Promoter Score, subtract the percentage of detractors from the percentage of promoters. For example, if 10% of respondents are detractors, 30% are passive, and 60% are promoters, you have an NPS of 50.
What Tools Can Be Used to Calculate and Track Net Promoter Score?
NPS can be collected and tracked quite simply with a form on your website. Promote it with an email to your list or a pop-up on your website.
You can also invest in specialized NPS software solutions or apps that offer features like analysis of your NPS over time or the ability to follow up on customer responses.
Tips for Tracking and Driving Growth with this KPI
- Send NPS surveys at key times when your users are most likely to respond, like within their first week (when they’re most engaged) or immediately after an interaction with customer service.
- Don’t neglect any segment of your customers.
- Send follow-up questions to promoters and detractors to find out more about how they feel.
- Consider prompting promoters to leave a review or refer within their network.
What Is the Average Net Promoter Score?
The average Net Promoter Score for SaaS and B2B companies is 40, but what matters more is your progress over time. Make changes based on comments or follow-up questions to send your NPS in the right direction.
30. Number of Active Users
This KPI is the total number of unique users that interacted with your product or service in a given time period.
SaaS companies also frequently use the terms monthly active users (MAU) and daily active users (DAU).
Why Should You Track the Number of Active Users?
If your product has a free version, you might get a lot of users who sign up but never come back. So tracking your total users doesn’t tell you about the health of your business.
The number of active users gives you more insight into how many people are engaged with your product and how many are loyalists rather than sporadic users.
How to Calculate Number of Active Users
Here’s where it gets confusing: there’s no rule for what counts as an active user. Some companies say that a user is “active” if they sign into the app or website, while others require them to take some other action, like using a certain feature.
You can define active however you want — just make sure you’re consistent in your tracking.
Number of active users always refers to unique users. If a user comes back to your product multiple times, they still only count as one active user.
What Tools Can Be Used to Calculate and Track Number of Active Users?
Google Analytics and other free analytics tools can help you track active users. You’ll probably have to implement some kind of tracking code on your app or website.
Tips for Tracking and Driving Growth with this KPI
Your definition of “active user” should be based on an action that is valuable to your business. For example, a website that relies on ads for revenue might be fine with active users simply logging in and scrolling, while a shopping app might only consider a user active if they click on a product.
How to Interpret the Number of Active Users
Number of active users isn’t a very useful metric on its own because a “good” number of users will be different for every platform. To get helpful insights from DAU or MAU, you can do two things.
First, you can look at trends. Gaining active users means you’re doing something right, while losing them could be cause for concern.
Second, many companies look at the DAU/MAU ratio. If most of your MAUs fail to become DAUs, you have a customer retention problem.
31. Customer Retention Rate
Your customer retention rate is the percentage of people who continue to use your product over a given period of time.
Why Should You Track Customer Retention Rate?
Keeping existing customers is easier and cheaper than acquiring new ones. Plus, a high customer retention rate means your customers like what you have to offer.
Customer retention affects other major SaaS metrics, like recurring revenue, growth, and customer satisfaction.
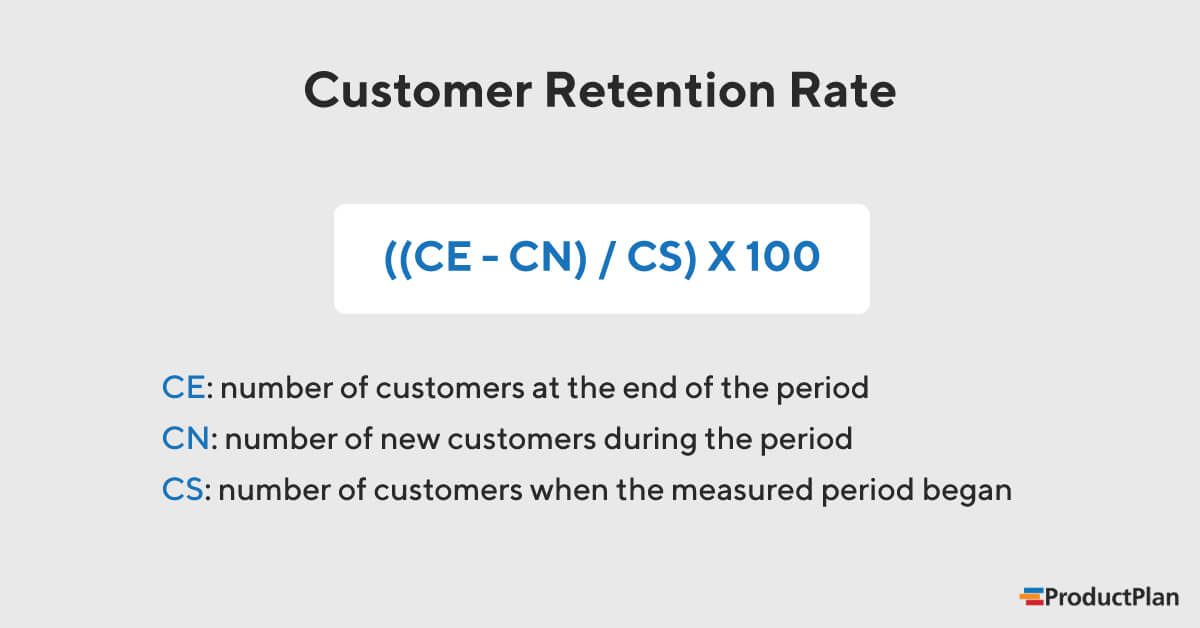
How to Calculate Customer Retention Rate
First, you need to define who counts as a customer. A freemium app might count active users, while a subscription business would use paying customers.
Start with the number of customers at the end of the time period. Let’s say you had 5,500 customers at the end of the year. Next, subtract the new customers you gained during that time period. We’ll say 1,000 new customers since January 1.
Now divide that number (4,500) by the number of customers you had at the beginning of the time period. 4,500 divided by 5,000 is 0.9. Multiply by 100 to find out that you had an annual customer retention rate of 90%.
What Tools Can Be Used to Calculate and Track Customer Retention Rate?
Whatever tools you use to count your customers — like Google Analytics to track active users or a CRM to track paying customers — will give you the information you need to calculate your retention rate.
Tips for Tracking and Driving Growth with this KPI
- Look at both long-term and short-term retention rates, rather than an average.
- Consider sending customer satisfaction surveys to find out why some customers stay and others don’t.
How to Interpret Customer Retention Rate
A higher customer retention rate is always a positive thing.
If you’re not happy with your customer retention rate, focus on ways to reward loyal customers, such as a rewards program or discounted add-ons.
32. Customer Churn Rate
Customer churn rate is the rate at which your customers are canceling their subscriptions. It’s also called an attrition rate.
Why Should You Track Customer Churn Rate?
Churn is the flip side of customer retention — instead of looking at how many customers are staying, you’re looking at how many are leaving.
It’s important because a high churn rate affects your bottom line and indicates a customer satisfaction problem.
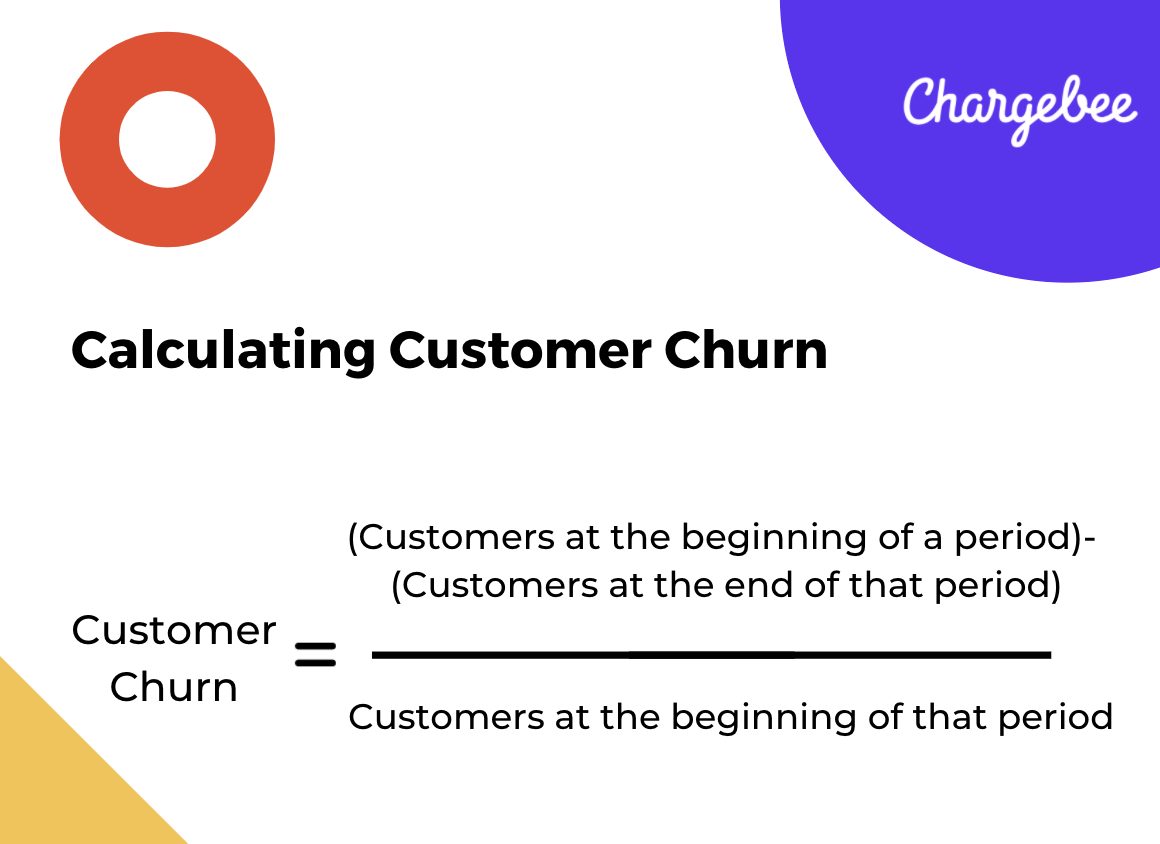
How to Calculate Customer Churn Rate
The churn rate formula is (lost customers ÷ total customers at the start of the time period) x 100.
For example, if your business had 1,000 customers at the beginning of the month and lost 100 by the month’s end, you would calculate that 100 divided by 1,000 is 0.1. Multiply by 100 to get a 10% churn rate.
What Tools Can Be Used to Calculate and Track Customer Churn Rate?
You can use your CRM or analytics tools like Google Analytics to track subscribers or active users. Either can be used to calculate customer churn rate.
Tips for Tracking and Driving Growth with this KPI
- Make sure you’re tracking both annual and monthly churn rates, as your campaigns to address churn should be both short-term (improving user onboarding, perhaps) and long-term (grandfathered pricing plans, perhaps).
- Consider tracking the churn rate for different customer personas or customers in different pricing tiers.
What Is a Good Customer Churn Rate
What counts as a good churn rate depends on a variety of factors, including your industry and type of product.
Rather than targeting a specific number, work on decreasing your churn rate over time. A good first step is to survey customers to find areas of satisfaction and dissatisfaction.
Final thoughts
Measuring these KPIs helps you gain insight into your business and track where you can improve and where you’re doing well.
It may feel intimidating to implement the tracking necessary to have visibility into these KPIs, but the right tools make it easy.
Chargebee gives you 360° business visibility with customizable dashboards and reports. Sign up for a free trial today.
