In a subscription business, churn is the rate at which customers/subscribers either cancel or don’t renew their subscriptions.
You might say: ‘Hey, let them churn. There will be more..’, but a business with a 5% monthly customer churn rate: will end the year with approximately half the customers it had at the beginning of the year.
In other words, it will have to add around 50% more customers during the year to reach the customer base it had at the beginning of the year. And acquiring these new customers is six times more expensive than the retention of existing customers. This kind of Customer Acquisition Cost (CAC) is often a worrying indicator to potential investors.
So, calculating and having a grip on your churn rate is a crucial driving factor for growth. But before we get into the fundamentals of calculating churn––why does churn happen in the first place?
How do you Calculate Churn Rate?
To calculate churn rate, divide the number of customers lost during a period by the total number of customers at the start of that period, and multiply by 100 to get the percentage
Churn rate formula
The formula is:
Churn Rate = (Lost Customers / Total Customers at start of period) x 100
Churn rate example
For example, if you start the month with 2,000 customers and 50 leave by the end of the month, your churn rate would be:
(50 lost customers / 2,000 total customers) x 100 = 2.5%
Some key points:
- Churn can be calculated monthly, quarterly, or annually. Monthly gives short-term trends while annual provides a broader picture of customer loyalty.
- Only include customers lost, not new signups, in the numerator. New customers in the period should not be included in the denominator either.
- Churn rate is a crucial metric for subscription businesses to track, as it directly impacts long-term sustainability and profitability.
- Analyzing churn provides insights into customer satisfaction and helps identify areas to improve the customer experience and reduce attrition
Customer Churn Rate Vs Revenue Churn Rate
You can calculate two kinds of churn: customer churn and revenue churn.
Now, customer churn would give you the rate at which you’re losing customers. But, revenue churn can indicate two things. It’s either revenue lost from a churned customer (customer churn). Or that a customer is still subscribed but is now paying you less––termed as ‘contraction.’
It’s essential to keep an eye on both metrics. In a given period, you could have 10% customer churn. But your revenue churn could be 30%. And that’s a worrying sign.
Let’s start with the first one.
Customer Churn Rate
Customer churn (or logo churn, or customer attrition) is calculated as the ratio of the number of customers lost during a specific period (typically a month or a year) and the number of customers present at the beginning of that time. It’s usually expressed as a percentage.
Customer Churn = [(Customers at the beginning of a period) – (Customers at the end of that period)] / [(Customers at the beginning of that given period)]
For example, consider the total number of customers at the beginning of 2019 to be 100. And through 2019, 5 of those customers canceled their subscriptions. Therefore, the customer churn rate would be: 5/100 or 5%
For a complete guide on analyzing customer churn, click here
Revenue Churn Rate
There are two types you could calculate under revenue churn: Gross Revenue Churn and Net Revenue Churn.
Gross Revenue Churn
For example, if you start the month with 2,000 customers and 50 leave by the end of the month, your churn rate would be:
(50 lost customers / 2,000 total customers) x 100 = 2.5%
Some key points:
Gross Revenue Churn shows you how much revenue you are losing, irrespective of revenue expansion, and upgrades within the existing customer base. It helps you focus on how much revenue leakage is happening.
Gross Revenue Churn Rate = [(Downgrade MRR + Cancellation MRR) / (Total MRR at the beginning of the period)] * 100
For example, if a company had $100,000 monthly recurring revenue (MRR) at the beginning of the month, and the subscription downgrades and cancellations totaled $10,000––then the gross monthly revenue churn rate would be 10%.
Net Revenue Churn
On the other hand, Net revenue churn attempts to paint a picture of the actual reality after taking into account what’s lost (via cancellations, downgrades) and what’s gained (via expansion, reactivation, and upgrades).
Net Revenue Churn Rate = [(MRR beginning of the month – MRR end of the month) – (Expansion MRR)] / [(MRR beginning of the month)] * 100
Net revenue Churn can be a negative churn, which is an excellent problem to have. That’s to say the business is making more money out of a cohort of customers than losing from the same cohort during a given period. Hence, net revenue churn is a better indicator of how your business is fairing.
For example, If a company had $300,000 MRR at the beginning of the month, $250,000 MRR at the end of that month, and $70,000 MRR in upgrades from existing customers, the net monthly revenue churn rate would be -6.6%
Revenue Retention Cohort Analysis
Cohorts are specific sets of customers or users grouped within a certain time frame based on their actions. It could be users who canceled their subscriptions in a particular month or users who decided to upgrade their subscriptions in a specific month, etc.,
Cohorts help you observe customer behavior better––leading to actionable insights. It’s a lot easier than trying to follow each customer individually.
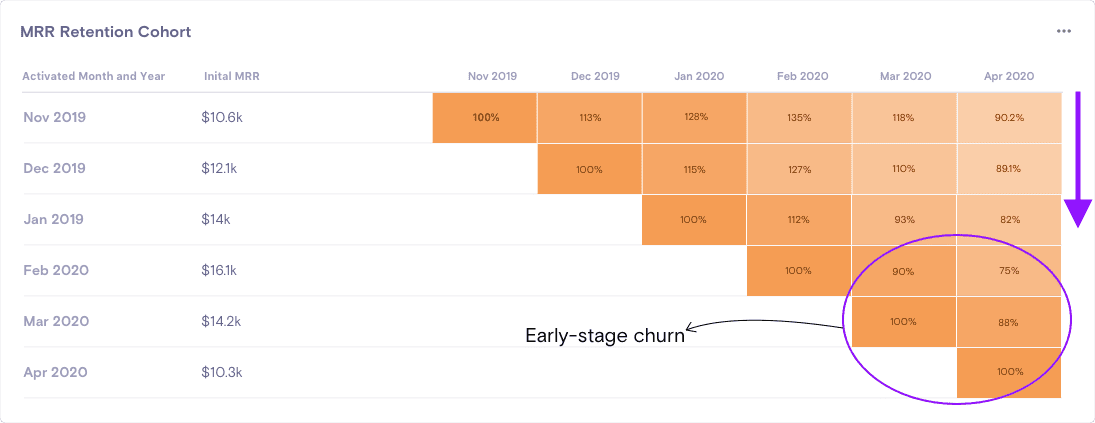
Below, we have an MRR Retention Cohort from Chargebee’s RevenueStory. Reading this chart is relatively simple and offers actionable insights.

Imagine the year to be Apr 2020, and you happen to be looking at this graph. Then, starting from the left:
- ‘Nov 2019’ would be a cohort of customers and indicates the MRR for that month.
- ‘$10.6k’ would be the MRR obtained for the cohort of customers in Nov 2019.
- In this case, there is 0% churn since we have retained 100% of the Initial MRR.
- ‘113%’ indicates a 13% increase in revenue in Dec 2019, through upgrades from the customers’ cohort activated in Nov 2019.
In the same way, we get the numbers all the way up till Apr 2020. So, how does this chart help us, and what does it indicate?
If we follow the purple arrow downwards, it shows you how much new revenue you acquired month on month. In the cohort above, observe an adverse revenue impact across customers (or cohorts) in April. But what’s more interesting is that customers acquired in the recent months (activated in Feb 2020 and Mar 2020) seem to have churned more than the older ones – indicating a high early-stage churn.
We’ll discuss ways to reduce churn, but before that, we need to know the acceptable churn rate.
4 ways to calculate your churn rate
When discussing churn rate calculations, it’s essential to recognize that different methods can provide insights tailored to specific business needs or operational focuses. Here’s a detailed exploration of the four methods to calculate churn rate:
1. Simple churn rate calculation
The simple churn rate calculation is the most straightforward approach. This method involves calculating the percentage of customers who have discontinued their subscriptions within a specific period. The formula is:
Simple churn rate= (Total Customers at the Start of the Period/Number of Churned Customers)×100%
This method is particularly useful for quickly understanding customer loss. However, it does not account for new customer gains during the period, which can provide a skewed perspective if customer acquisition rates are high.
2. Adjusted churn rate
The adjusted churn rate improves upon the simple churn rate by considering new customer acquisitions during the period. This method provides a more balanced view by adjusting the churn rate to reflect new entries into the customer base, thus offering a clearer picture of net customer loss or gain.
Adjusted churn rate= {(Total Customers at the Start of the PeriodNumber of Churned Customers−Number of New Customers)/Total Customers at the Start of the Period} ×100
This calculation is particularly valuable for businesses in growth phases, where new acquisitions frequently offset customer losses.
3. Revenue churn rate
The revenue churn rate examines revenue beyond the number of departing customers—it zeroes in on how much revenue is slipping through the cracks because of these losses. This figure is particularly vital for subscription-based models, where every customer’s contribution to the Monthly Recurring Revenue (MRR) matters significantly.
Losing high-value customers hurts—it’s not just a subtraction on a spreadsheet but a dent in your predictable income stream. For businesses that depend heavily on stable MRR, this can be alarming.
The revenue churn rate is calculated by:
Revenue Churn Rate=(Total Revenue at the Start of the Period/Revenue Lost from Churned Customers)×100%
This calculation helps businesses not only understand the direct financial impact of churn on MRR but also guides more nuanced strategic decisions to enhance revenue retention.
4. Predictive churn rate
Predictive churn rate uses ancient statistics to forecast destiny churn. This method employs statistical fashions and gadgets gaining knowledge of algorithms to expect which customers are in all likelihood to churn primarily based on their behavior styles and engagement degrees. The predictive churn rate isn’t expressed in a simple method because it includes complicated information modeling and evaluation approaches.
Predictive analytics can be mainly powerful. They allow organizations to proactively implement retention strategies focused on high-threat customers, hence doubtlessly reducing churn earlier than it occurs.
Each technique presents unique insights and may be selected primarily based on the enterprise’s unique wishes and statistics abilities. By combining multiple procedures, agencies can gain a complete understanding of churn and more efficaciously tailor their patron retention strategies.
What is a good churn rate?
A good annual churn rate for established SaaS companies is often between 5 and 7%. This corresponds to a monthly churn rate of approximately 0.4-0.6%. A healthy turnover rate for startups and smaller SaaS enterprises is usually between 10-15% annually. Maintaining an average turnover rate below these benchmarks is good because it demonstrates strong client loyalty and retention.
However, churn rates might vary greatly depending on various circumstances. Larger, more established SaaS organisations experience lower turnover than startups achieving product-market fit. Businesses focused on quick expansion may experience higher churn since they prioritise new client acquisition above retention. Certain industries or consumer categories may also see greater natural churn rates.
The idea is to monitor your company’s churn over time and aim to consistently improve it, rather than relying entirely on industry norms. Reducing churn below the “acceptable” level should be a major objective for long-term SaaS growth, as high churn can swiftly undermine a company’s success.
What is a high churn rate?
A high churn rate typically suggests that a large number of customers are departing a business in a given time period. While the precise definition of a “high” churn rate differs by industry, here are some essential points of high churn:
- For established SaaS enterprises, a yearly churn rate of more than 5-7% is considered high. This amounts to a monthly rate greater than 0.4-0.6%.
- Annual churn of more than 10-15% is considered excessive for startups and smaller SaaS enterprises.
- A high churn rate indicates that a company is paying substantially on customer acquisition but not receiving a satisfactory return, as new customers are not replacing those lost.
- Churn rates vary depending on firm size, industry, business style, and client type. Certain verticals, such as gaming, anticipate increased turnover.
- High churn reduces revenue growth and profitability. To achieve long-term success, SaaS organisations should prioritise lowering churn rates.
- Analyzing where and why customers churn can provide insights to improve user experience, features, and pricing and ultimately lower churn rates.
The key is to track churn over time and work to continuously improve it, rather than just comparing it to industry averages. A high churn rate indicates significant room for improvement in customer retention.
What is an Acceptable Churn Rate?
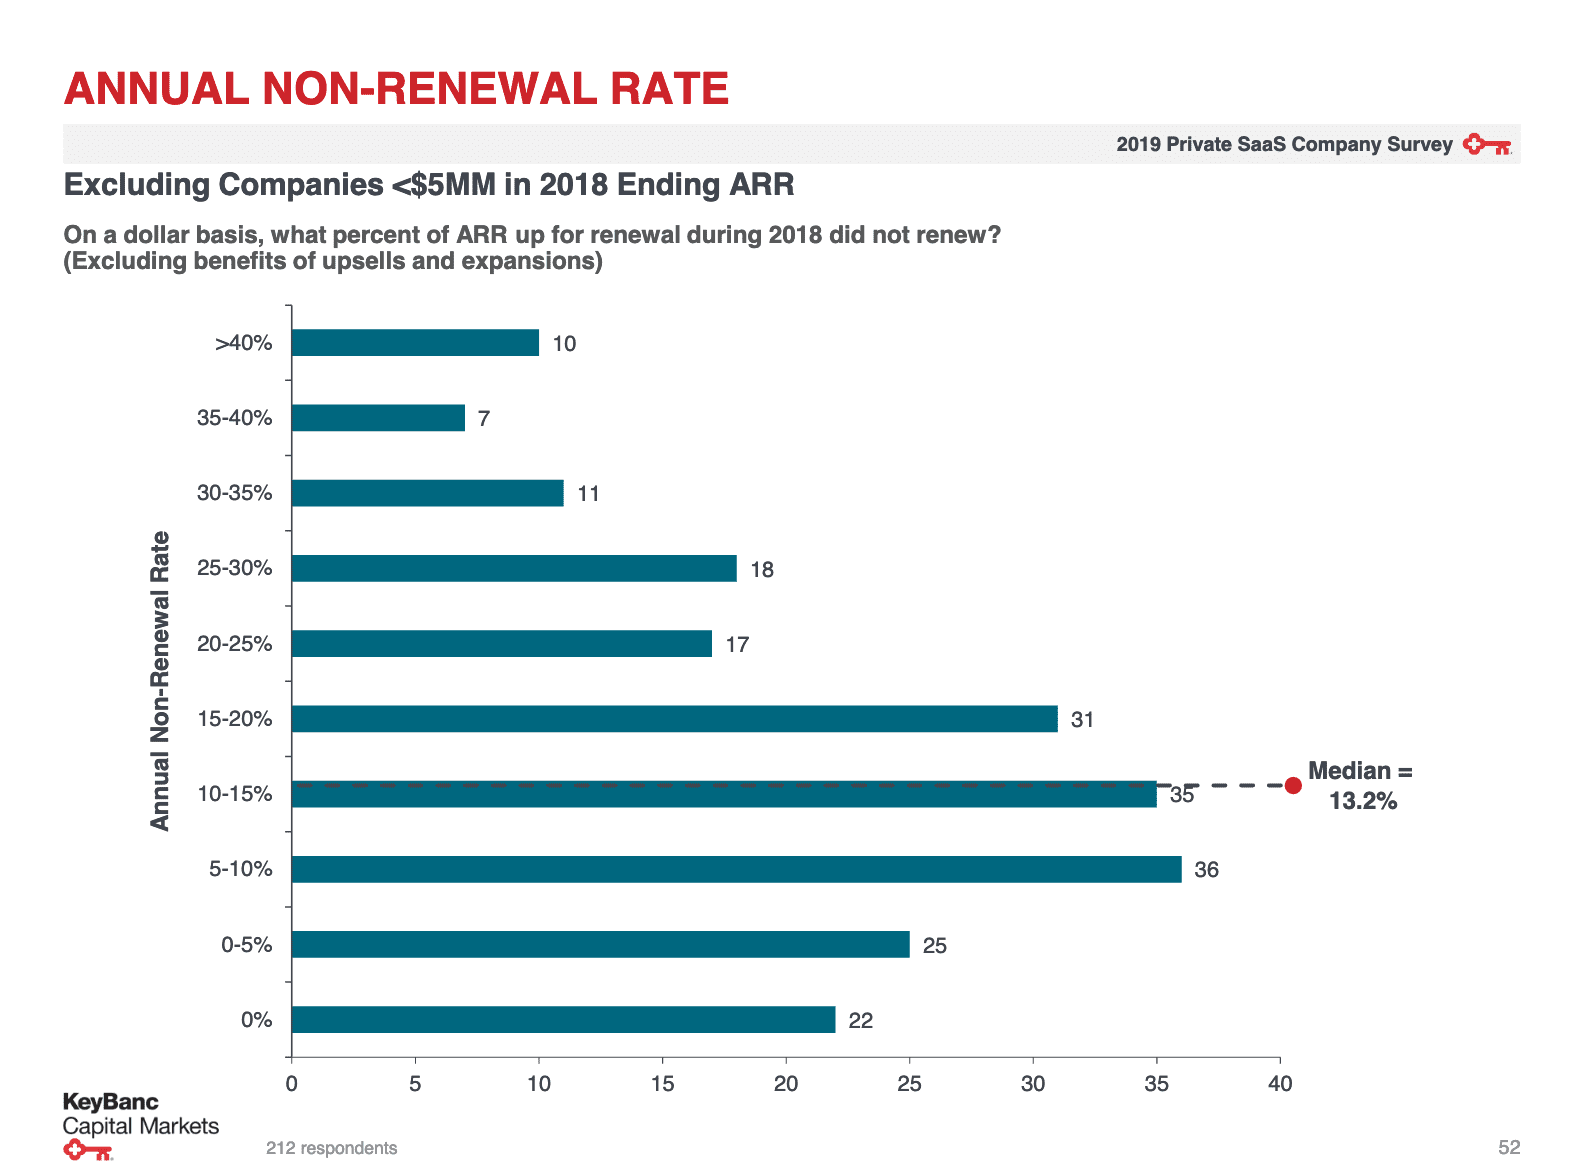
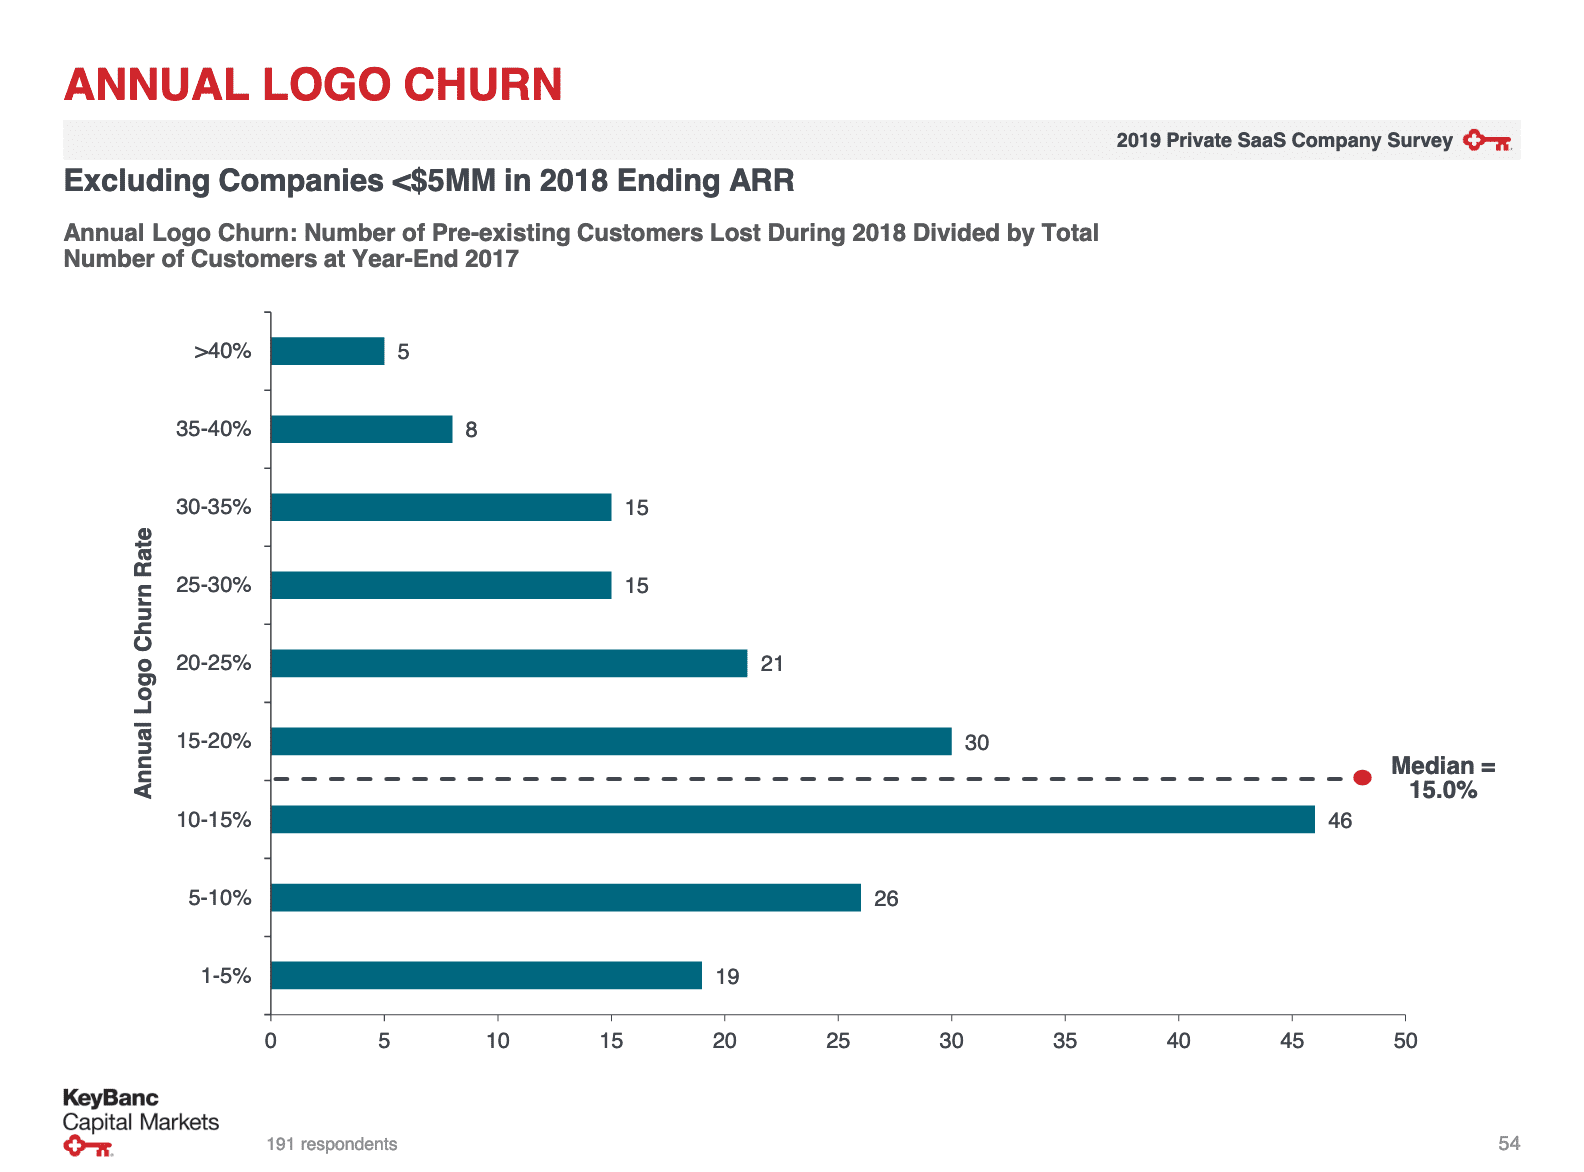
A 2019 SaaS report by KeyBanc Capital Markets pegged the median annual revenue churn benchmark at 13.2% and yearly median logo churn (aka customer churn) at 15%. However, this report excludes companies with less than $5 million in revenue.


Churn rates vary across businesses depending on the market, the customers they serve, and the competitive levels in those markets. For instance, B2B SaaS businesses are likely to see lower churn than OTT providers or those in consumer services.
Factors such as pricing plans, contract duration, and business maturity also significantly impact the churn rate. According to Profitwell, companies that are less than three years old see a wide churn range of 4%-24%, whereas companies that are more than ten years old see a churn rate of 2%-4%.
You need to continuously improve to get that churn rate to the 5-7% annual range. Anything above would be a high churn rate. High churn rates are a symptom of an underlying business problem. If you want to scale to new heights: you need to address these problems.
Now, if you’re thinking: “where do I even start?” fret not––below, we’ve listed the best ways you can get that churn under control.
How to reduce churn rate?
SaaS organizations should prioritize improving the customer experience throughout the lifecycle to reduce churn. This includes optimising the onboarding process to immediately demonstrate value, improving customer assistance to fix concerns efficiently, and providing flexible subscription alternatives such as annual plans to encourage long-term commitments. Analyzing churn data to identify fundamental causes and executing focused methods to alleviate them is critical. Regularly soliciting client input and iterating on products and services can reduce churn over time. SaaS companies can improve customer loyalty and achieve sustainable growth by implementing a proactive, data-driven retention strategy.
10 Ways to Reduce Churn
- Invest in Subscription Analytics
- Double Down on Customer Engagement
- Nail a Positive Onboarding Experience
- Identify high-risk customers that are likely to churn
- Define High-value Customers
- Improve Customer Support
- Learn from Complaints and Tickets
- Offer Annual Pricing
- Implement Smart Dunning Workflows
- Improve Product and Features Consistently
Read more: Dive deeper into these 10 points on reducing churn in our blog.
How to Track churn rate easily with Chargebee?
Calculating and managing churn rate is critical to the long-term survival of any subscription-based organization. Understanding different types of churn, using reliable calculation techniques, and continually improving customer retention can greatly enhance your company’s development and profitability.
So, how can you quickly track churn rate with Chargebee? Chargebee provides an extensive suite of tools to facilitate churn tracking and analysis.
- Automated Calculations: Chargebee automatically calculates both customer and revenue churn rates, saving you time and eliminating the possibility of manual errors.
- Real-time Dashboard: Use an easy dashboard to monitor your churn stats in real-time, allowing you to identify trends and take immediate action.
- Cohort Analysis: Easily segment your customers into cohorts to identify churn behaviours across groups.
- Custom Reports: Create thorough, customisable reports on churn and other key metrics to distribute to your team or stakeholders.
- Predictive Analytics: Use Chargebee’s advanced analytics to identify possible churn risks and take preemptive steps.
- Integration Capabilities: Chargebee integrates with your existing systems, allowing you to combine data and gain a comprehensive understanding of your churn indicators.
Using these tools, you can gain deeper knowledge about your churn patterns and take the initiative to enhance customer retention. It is important to note that there is no one-size-fits-all approach to reducing churn. A holistic approach that includes refining your product, improving customer service, optimizing onboarding, and using data-driven insights is necessary.
However, what constitutes an acceptable rate of turnover varies depending on the industry and the stage of the business. This will involve focusing on delivering value for customers while effectively addressing their needs to strengthen relationships with them, promote customer lifetime value incrementally, and develop a more sustainable company model.
Finally, managing churn is a continuous effort that takes devotion and adaptability. Chargebee’s effective churn monitoring and analysis gear can help you switch churn into a possibility for improvement and innovation in your SaaS business.
Ready to raise your churn management to the next level? Chargebee provides everything you need to measure, examine, and eliminate churn conveniently. From automated calculations to thorough records, we have the tools you need to keep your consumers engaged and your business growing.
Schedule a demo with Chargebee today and discover how we can help you master your churn rate and accelerate your SaaS growth.

